Just as fresh fruits and vegetables are part of a balanced diet, they are also an essential part of a diverse, resilient and secure food system. Specialty crops are produced on nearly a quarter-of-a-million U.S. farms, with a market value of $63 billion per year and rising steadily in recent years.
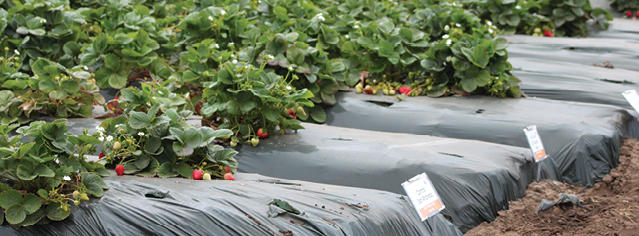
Although fruit and vegetable revenue represents a relatively small portion of the farm economy, these crops provide young and beginning farmers an opportunity to overcome barriers to entry by producing high-value crops that require relatively low investments of capital. Fruit and vegetable crops also offer row crop producers an opportunity to increase the economic and biological resilience of their operations. Introducing fruit and vegetables into traditional crop rotations diversifies the farmscape, providing new sources of income, interrupting pest and weed cycles, and conserving natural resources. Farmers who respond to the growing consumer demand for fresh, healthy products strengthen socio-economic bonds with local communities and improve domestic food security in the process.
SARE grantees are leading the way by exploring innovative, research-based models for fruit and vegetable production and marketing. In concert with land-grant researchers and Cooperative Extension agents, and with support from SARE, sustainable farmers are expanding production capacity and marketing networks through hard work and entrepreneurship to improve the profitability and sustainability of agriculture. (See the story, Financial Management Training Cultivates Farm Business Success.)
By the Numbers - SARE Grants on Specialty Crops, 1988–2017
Getting the Word Out

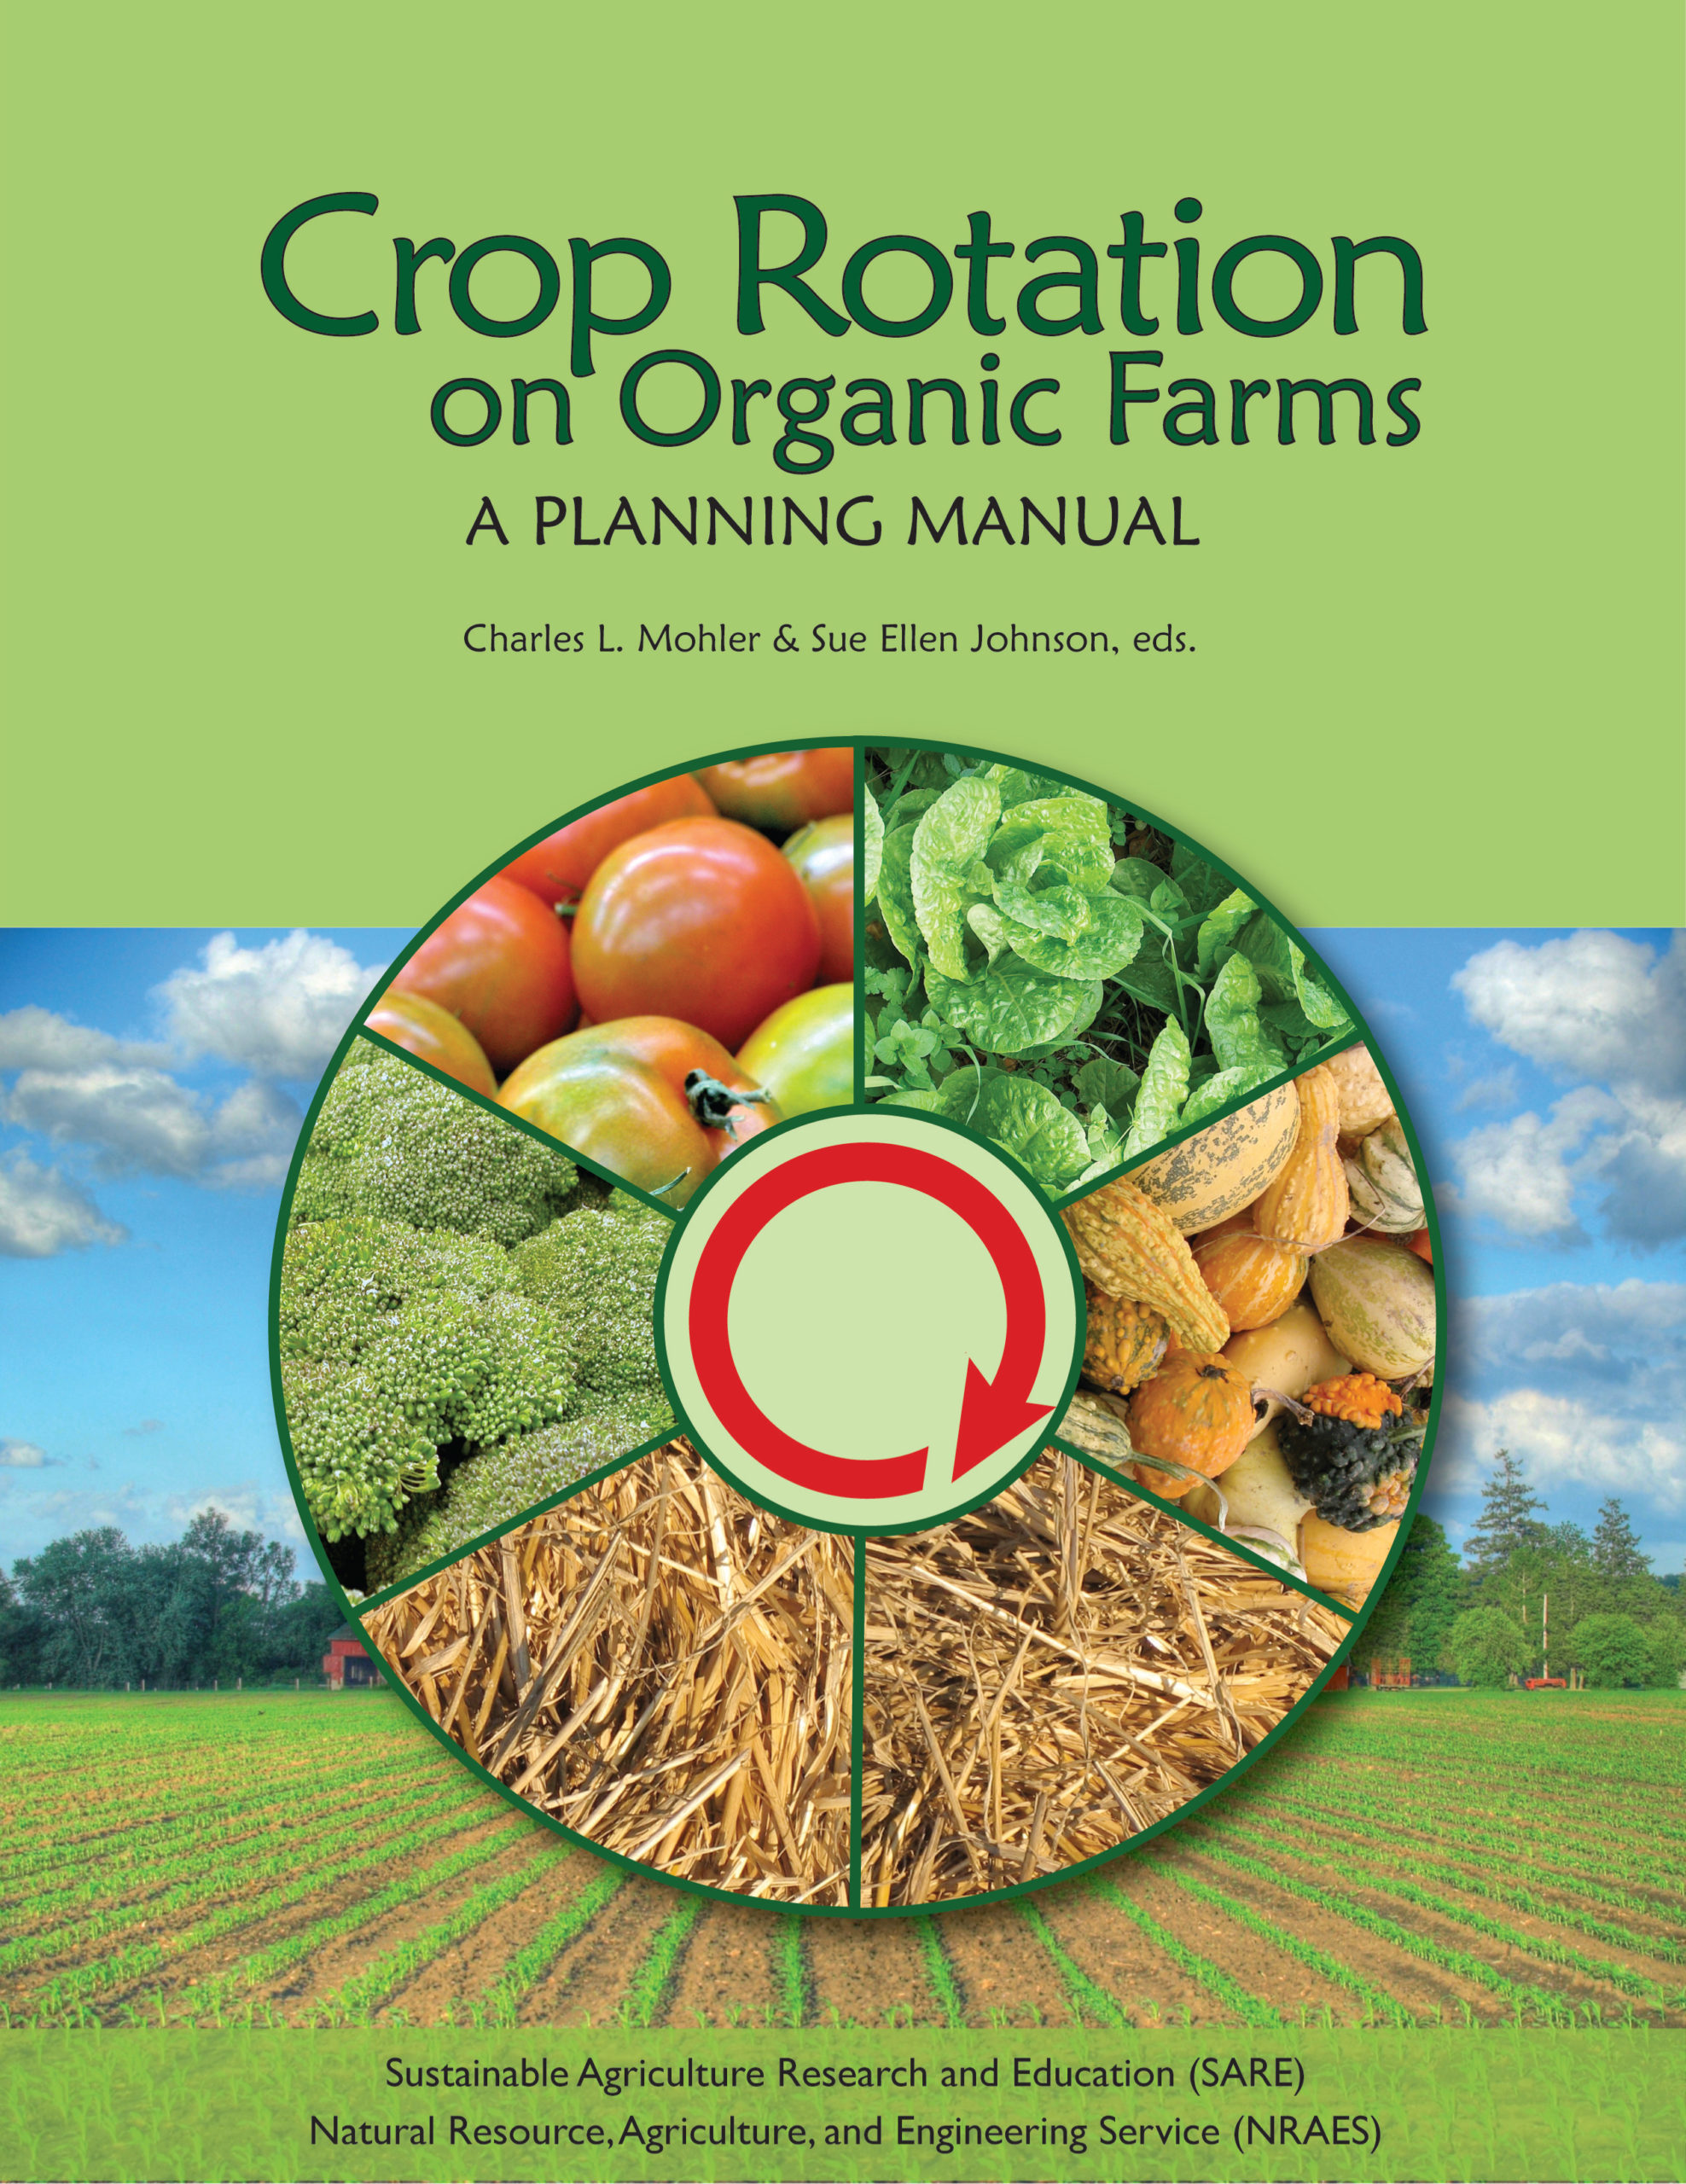
SARE produces dozens of educational resources on a range of sustainable agriculture topics. Grantees produce even more with SARE funding. Here are just a few examples that address specialty crops (or see all SARE resources on fruit and vegetables):
Print: 25,005 | Online: 92,106
Print: 7,223 | Online: 106,408
Print: 7,643 | Online: 21,921
Print: 3,461 | Online: 8,991
“Print” is copies distributed since the date of publication. “Online” is combined downloads and unique page views over a recent six-year period.
Visit the database of project reports to explore SARE-funded research on these topics.
![]() 485 grants | $12.5 million
485 grants | $12.5 million
![]()
156 grants | $4 million
![]()
315 grants | $4.8 million
![]() 324 grants | $8.1 million
324 grants | $8.1 million
![]()
142 grants | $3.5 million
![]()
543 grants | $12.7 million
![]() 493 grants | $14 million
493 grants | $14 million
![]()
1,266 grants | $38.5 million
2,431 grants | $74.6 million
Because some projects address more than one topic, the total is adjusted to remove duplicates.

