Planning Task Two
Prepare a brief history of your family, farm and business. Assess your current situation in:
Marketing:
- Product
- Customers
- Unique Features
- Distribution
- Pricing
- Promotion
- Anticipated Marketing/Industry Changes
Operations:
- Physical Resources
- Production Systems
- Management Systems
Human Resources:
- Work Force
- Unique Skilllls
- Anticipated Changes in the Work Force
Finances
- Needs
- Performance
- Risk
- Financial Environment and Anticipated Changes
Conduct a whole farm SWOT analysis
Prepare the History and Current Situation section of your Business Plan
A clear understanding of your farm operation’s history and current situation is the second building block in the foundation for your business plan. Your evaluation of alternative strategies for your farm and your efforts to persuade others that the strategy you ultimately propose is workable must be based on a comprehensive, realistic assessment of your current situation.
The materials in this chapter guide you through the development of such an assessment. This task requires time and effort—which will pay off later in the planning process. You’ll begin by preparing a brief history of your family, farm, and business. Next, you’ll systematically assess your operation in terms of the four key management areas: marketing, operations, human resources and finances. Finally, you’ll summarize your operation’s history and current situation to include in your business plan.
A Brief History of Your Business
Before jumping into a summary of your current situation, it’s important to look back to important events and decisions from the past one, five or ten years—whatever time frame can best describe why and how you’ve arrived at your current business situation.
If you’re an experienced farmer or business owner, think about the different phases you have gone through in terms of marketing, operations, human resources and finances. Identify your most important successes and failures as well as the key opportunities and challenges you have encountered. Reflect on what you’ve learned from your experiences. Consider how your values have shaped the choices you’ve made.
If you’re a beginning farmer or rural entrepreneur, focus on previous personal, economic, environmental, and community experiences that triggered your current desire to begin a business. Also, take time to learn about the history of the land you’ll farm, the markets you’ll serve and the industry you plan to enter. Understanding and developing strategies to serve viable markets is a key aspect of the business planning process and a critical ingredient for the success of your business plan. It’s important to look beyond your own operation to its economic environment as you review the history of your business.
This review of your business and personal history, as well as market and industry trends, will be valuable as you develop a business plan, particularly as you begin to consider alternative strategies. The circumstances and ultimate decisions leading up to previous business successes and failures will provide insights as you choose between future strategic business options. Keep your history, as well as the values driving previous decisions, in mind as you continue to plan.
Use Worksheet 2.1: A Brief History of Our Farm Operation (download worksheets for task 2) as a guide for writing your farm history. For now, you and other planning team members are the intended audience, so don’t be too concerned about length or writing style. The important thing is to document key events and key decisions and to reflect on how these have shaped not only your current situation, but also your dreams for the future.
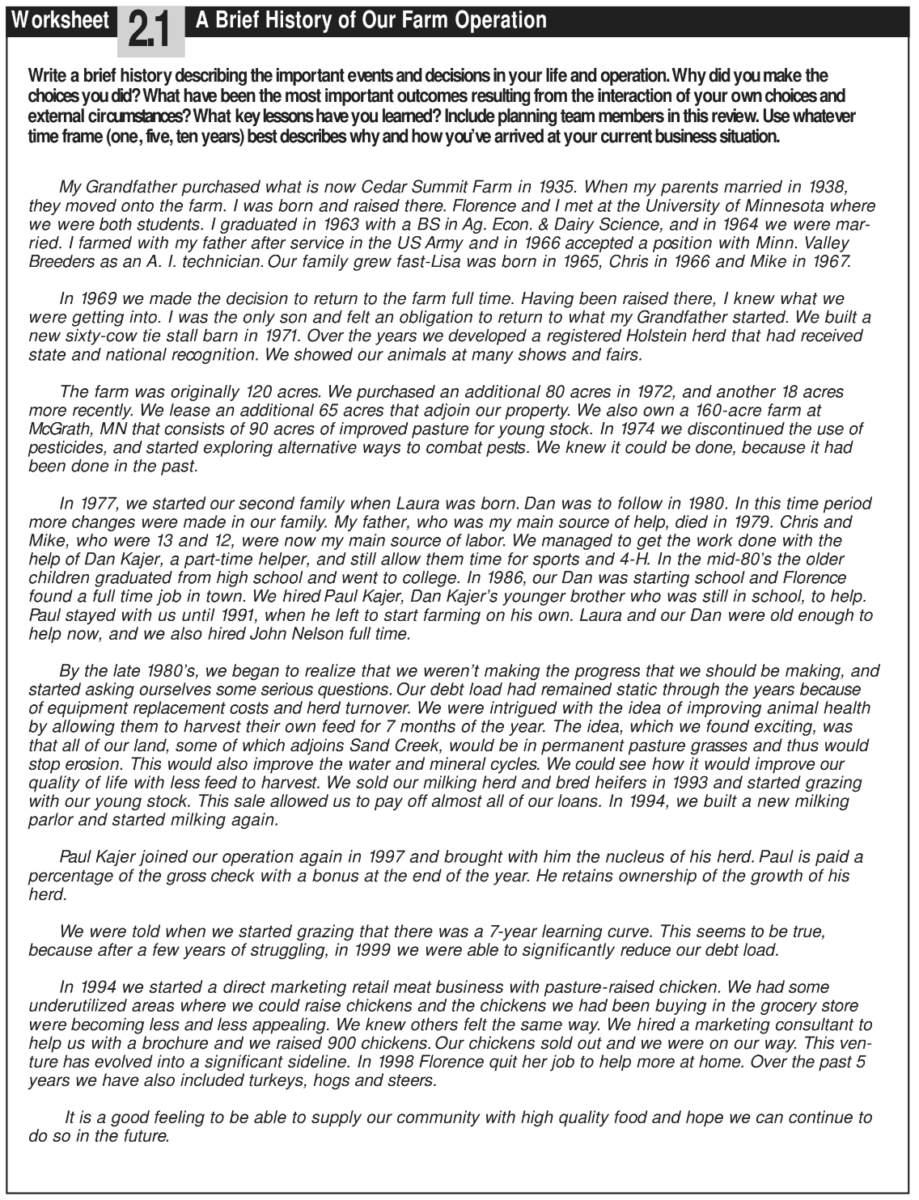
Dave Minar’s history of Cedar Summit Farm shows one method that can be used to review your business and personal history (Figure 5). He simply chose to describe key events in the nearly forty years he and his wife, Florence, have been farming together. During that time, both their family and their farm operation have grown. They have made important choices that have shaped their current situation and the strategies they are considering for the future. These include the decision to stop using pesticides in 1974, the shift to grazing in 1993, and the addition of a direct marketing meat business in 1994. This history clarifies the context for the Minars’ desire to add on-farm milk processing and direct marketing of dairy products to their farm business.
Asses Your Current Situation
The current circumstances surrounding your life and business can create unique opportunities as well as obstacles. This section guides you through a description of your current situation for each of four business management functions: marketing, operations, human resources and finances. This is a chance to inventory your resources and assess how well you are using them.
In each management area, you’ll collect facts and figures that will help you evaluate your operation in terms of Strengths, Weaknesses, Opportunities and Threats (SWOT). The SWOT analysis is a planning tool used by businesses and organizations of all sizes and types. Strengths and weaknesses refer to factors that are internal to your business. Opportunities and threats refer to your business’ external environment. Ultimately, your plans for the future should help you build on your strengths and overcome your weaknesses. Your plan should help you take advantage of opportunities or ward off threats offered by your environment. Keep a running list of strengths, weaknesses, opportunities and threats in each management area as you work through the text and Worksheets in this section. Finally, you’ll summarize that information and make an overall SWOT analysis for your business that you can include in your final business plan.
Involve members of your planning team and other business stakeholders in this process. Assessing your current situation from several points of view can help you gain perspective on the issues and alternatives that your business plan will address.
Marketing Situation
When you ask another farmer to describe his or her operation, the response will usually begin with information on the number of acres farmed, the type of crops grown, and livestock raised. This made sense for the “old agriculture” when focus was on selling undifferentiated commodities to anonymous buyers. More and more, we are moving toward a “new agriculture” where farmers sell differentiated products and are in direct contact with their customers.
Evaluate Your Current Situation for:
S = Strengths
W = Weaknesses
O = Opportunities
T - Threats
You can begin with any of the four management areas as you develop a description of your operation, but we encourage you to consider starting with an assessment of the markets you serve and your strategies for serving them. These are the key questions you’ll need to answer:
You can begin with any of the four management areas as you develop a description of your operation, but we encourage you to consider starting with an assessment of the markets you serve and your strategies for serving them. These are the key questions you’ll need to answer:
- Product: What is our product?
- Customers: What markets do we serve?
- Unique Features: What are the unique features that distinguish our products?
- Distribution: How do we distribute our products?
- Pricing: How do we price our products?
- Promotion: How do we promote our products?
- Market and Industry: How is our market changing?
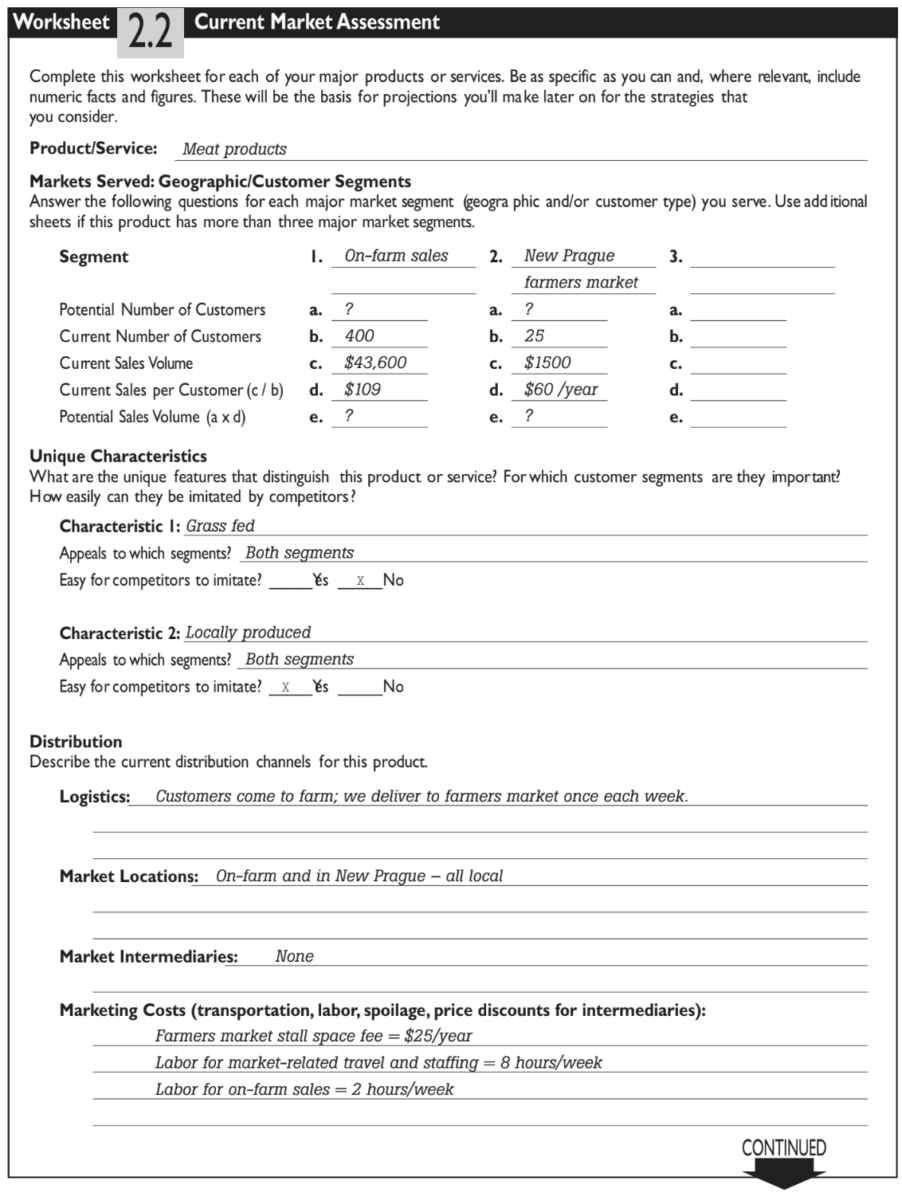
Use Worksheet 2.2: Current Market Assessment (download worksheets for task 2) to record your answers as you work through this section. The Minars’ Current Market Assessment Worksheet for their meat products (beef, pork, chickens and turkeys) is reproduced as Figure 6.
Product: What is our product?
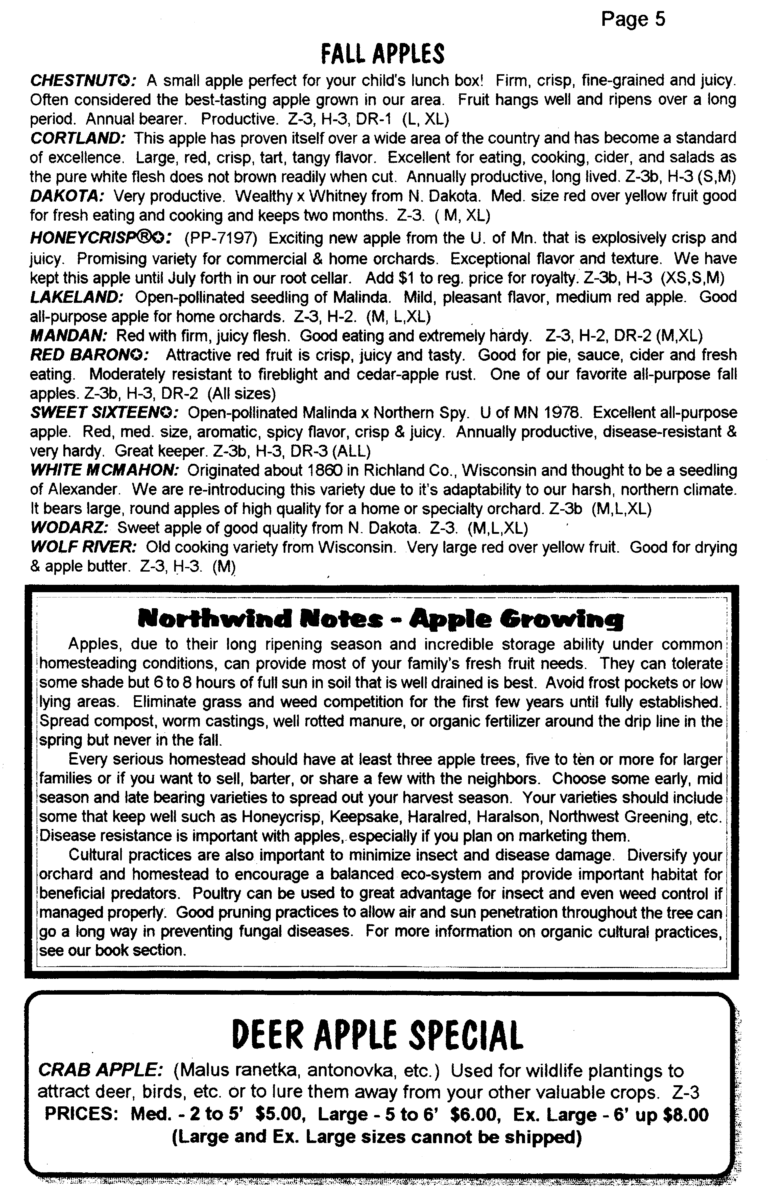
This is usually an easy question—but it’s sometimes useful to step back and think about what it is that you produce. What is a product? For example, Frank Foltz of Northwind Nursery and Orchard produces edible landscaping plants that are well-adapted to northern winters. Yet, he also provides knowledge and information in the form of “Northwind Notes” and annual workshops to help educate his customers about fruit production and other homesteading skills. Is this service component of his business something that’s simply “bundled” with the plants he sells, or does it have the potential to be a separate product? For each product you produce, fill out a copy of Worksheet 2.2: Current Market Assessment. As you ponder the question; What is our product? you may identify products that have great potential. For practical purposes, products are defined as commodities, final consumer goods, and services.
Customers: What markets do we serve?
We often think of a market as a place, but it’s more useful to think of your markets in terms of the potential buyers for your products. Some examples will help illustrate this concept of a market:
- Greg Reynolds of Riverbend Farm sells fresh, organically produced vegetables to restaurants, food cooperatives, and Community Supported Agriculture (CSA) customers in the Twin Cities metropolitan area.
- Mary Doerr of Dancing Winds Farm sells goat cheese made on her farm to shoppers at the St. Paul Farmers’ Market. She also offers visitors to southeast Minnesota an opportunity to enjoy her farm and to learn about cheese making by staying in her bed and breakfast.
- Dave and Florence Minar sold milk to their local cooperative and pasture-raised poultry, beef and pork to customers from the greater Twin Cities metropolitan area who visit Cedar Summit Farm.
Each of these short market descriptions indicates not only where products are sold—the geographic scope of the market—but also to whom they are sold. [Note that it is common to serve more than one market and that the customers in a market can often be segmented into several distinct groups.]
Once you have a basic description of the market or markets you currently serve, you’ll need to gather more detailed information on the segmentation, size and scope of your market, as well as who is already serving the market. Are there distinct segments in your customer base—for example, households and businesses? How many potential customers are there in each segment in the area you serve? How many customers do you have in each segment and how much do they buy? Use the “Markets Served” section of Worksheet 2.2 (download worksheets for task 2) to answer these basic questions for each of the markets you serve. This will help you identify the most attractive market opportunities.
Dave and Florence Minar identified two distinct market segments in
their current market assessment for their meat products (Figure 6). The first segment is on-farm sales. They had about 400 customers in this segment, and in 2000 they had total sales of approximately $43,600. This implies annual sales per customer of $109. The second market segment was the New Prague Farmers’ Market. Dave and Florence estimated that they have approximately 25 customers in this segment. Their sales volume for this segment was $1,500, or $60 per customer.
It’s not unusual to have some question marks in this segment of the Worksheet, as the Minars do. These point to areas where it may be important to gather information as you begin to look ahead to expanding sales within a particular segment or to entering a new market segment.
Unique Features: What are the unique features that distinguish our products?
Unique characteristics differentiate your product and make it more attractive to your customers. For example, Riverbend Farm owner Greg Reynolds’ vegetables are known by restaurant owners and food cooperative produce buyers for freshness and high quality. As a result, these customers prefer to buy from Riverbend Farm whenever possible. Similarly, the milk Dave and Florence Minar produce is unique because their cows are pasture-fed. Many consumers who have tried graziers’ milk prefer the taste, and there is some evidence that it may have health benefits that are not present in conventional milk. Some consumers also prefer graziers’ milk because they want to support and encour- age this production method. When Dave and Florence Minar began the business planning process in 1998, they recognized these distinctive features of the milk they produced, but were unable to capitalize on these differences since they sold it to a cooperative where it was blended with milk from other farms.
Dave and Florence identified two distinguishing features of their meat products—the animals are grass-fed and locally produced. These characteristics appeal to their retail customers in both market segments. The grass-fed characteristic is difficult for competitors to imitate, but other producers in their area can offer locally produced meat products.
As you complete the “Unique Characteristics” section of Worksheet 2.2, (download worksheets for task 2) ask whether the unique characteristics of your products appeal equally to all the market segments you serve. A product attribute that is important to one group of customers may be irrelevant to others. This is a good time to think about product features that appeal most to each customer segment. Even if your product or service is not strong in delivering those features, your business plan may focus on ways you can improve your operation to make your product more appealing to market segments with good growth potential.
Distribution: How do we distribute our products?
Distribution is the work of getting products from your farm to your customers. A distribution system is described in terms of the logistics—processes used to store and transport the product, the places where the product is sold, and the market intermediaries that help facilitate the flow of your product. In broad terms, most farm product distribution systems can be grouped into three categories:
Sale of a commodity product to a first handler or processor—for example, sale of grain to a local elevator, milk to a creamery, or hogs to a slaughter plant.
- Sale through a grocery wholesaler or retailer—for example, sale of processed, packaged chickens through a local retailer, sale of a branded pancake mix through a natural foods distributor, or sale of fresh vegetables through a natural foods cooperative.
- Direct marketing—for example, sale of fresh produce at a roadside stand, sale of farm-produced cheese at a farmers’ market, or catalog sales of bare-root nursery stock.
Of course, within each of these categories there is an endless range of variation for specific products. Dave and Florence use direct marketing for their meat products, with simple logistics and no intermediaries. Their direct costs for market access and travel to the farmers’ market are modest, but it’s important to note that they also use about 10 hours of valuable labor time each week. It’s also interesting to note that most of their distribution costs are linked to sales at the farmers’ market, while most of their sales appear to be on-farm. Of course, their presence at the farmers’ market may be their best way to make first contact with potential customers for on-farm sales.
As you describe the distribution systems you currently use for your operations, think about how well they help you preserve the unique characteristics of your product. The Minars preserve the unique qualities of their grass-fed meat by direct marketing their meat products. However, by selling their milk to the local cooperative, the Minars were losing the opportunity to reach customers who were willing to pay a premium for graziers’ milk. It’s also important to think about the costs and cost savings associated with your current system. The Minars’ distribution system for their milk was less costly than a system that involves on-farm processing and sale through local retailers or home delivery.
In general, commodity distribution systems are the least expensive, but they also offer the fewest opportunities for establishing close contacts with consumers and for adding value through unique characteristics. Direct marketing systems offer the greatest opportunity for customer contact and product differentiation, but they are often the most expensive when costs for time and transportation are added. Selling through a wholesaler or retailer—that is, connecting with your ultimate customer through market intermediaries—is sometimes an attractive alternative to the other two distribution systems. You can often keep a strong link with your customers by using distinct packaging or by doing regular in-store product demonstrations. Also, there are clear cost savings in sharing storage, transportation, and product display costs. Most of those cost savings, however, will go to the wholesaler or retailer. In other words, when you work through an intermediary, you will need to share the proceeds of the sale to the final consumer with the retailer or wholesaler.
As you complete the “Distribution” section of Worksheet 2.2 (download worksheets for task 2) for each of your major products, think about the advantages and disadvantages of current systems. Are there significant opportunities for reducing costs or increasing revenues by improving your current distribution system or shifting to something new? If there are, this is an area to revisit later in the planning process when you begin developing strategies for more effectively meeting the goals you set for your operation.
Pricing: How do we price our products?
The prices you charge for your products are influenced by production costs (yours and your competitors’) and by your customers’ willingness to pay. From a farmer’s perspective, it would be great to set product prices at levels that cover all costs and include a “fair” profit. However, your ability to do this will depend on the actions of your competitors and on the strength of your customers’ demand for the characteristics that make your product or service unique. You’ve almost certainly seen these market forces at work on any visit to a farmers’ market. When there are several producers selling the same product, with no significant differences among them in quality, the price will quickly converge to a single level. Originally, this may be at a level that covers all costs and yields a profit, at least for the most efficient producers. By the end of the market day, though, the price for a perishable product may drop well below production costs if several producers still have a large supply of product that will be wasted if not sold. In this same situation, if customers perceive one producer’s product as higher quality, that producer will be able to charge a higher price. As the price of the higher quality product increases, though, the least loyal customers will opt for lower price over higher quality. Competition sets a ceiling on the price the market will bear for any product. The more intense the competition, the more difficult it will be to charge a premium price. In this example we have focused on competition at the same farmers’ market. It’s important to recognize that the relevant competition may be the local supermarket or some other product altogether.
Dave and Florence Minar used their 2000 financial analysis (created with FINPACK software 2 ) to calculate average prices they receive for each of the four meat categories they market. The prices for beef and pork reflect retail sales per pound of live weight. They are, of course, much lower than prices for retail cuts of meat, but they are well above prices farmers receive for “commodity” steers and hogs. Similarly, the prices for chickens and turkeys are on a per bird basis, and they are well above retail prices for “commodity” chickens and turkey. The Minars note that they have a high level of power in setting prices for these products, but they also face some demand sensitivity to price changes.
As you complete the “Pricing” section of Worksheet 2.2 (download worksheets for task 2) for each of your products, record the typical price level (or range of price levels if there is significant variation) and the size of the premium, if any, that your product receives over a typical competitor’s price. Also, comment on your ability to set the price and the sensitivity of demand to price increases. For example, if you are the only seller of a truly unique product, you have a high degree of power in setting the price. You may have no power if you are selling into a highly competitive market with many other sellers. Regardless of your ability to establish a price, the quantity you sell may or may not be sensitive to price increases. Demand for a unique, high-quality cheese may hardly be affected by a significant price increase, while buyers of free-range chickens may switch to grass-fed beef if the price of chickens rises dramatically relative to that of beef.
Promotion: how do we promote our products?
Effective product promotion is critical for successful marketing. We often think of advertising when we hear the term product promotion. This may take the form of brochures, posters or a Web site. Of course, there are many other ways you can inform potential customers about your products. For example, many producers offer taste tests for their products in retail stores and at farmers’ markets. Other producers rely on promotional efforts by a commodity group or collaborative marketing group. A good example of this kind of promotional strategy is “eco-labelling.” Several organizations throughout the country have certification programs to recognize food that is produced according to specified ecological or sustainability standards.
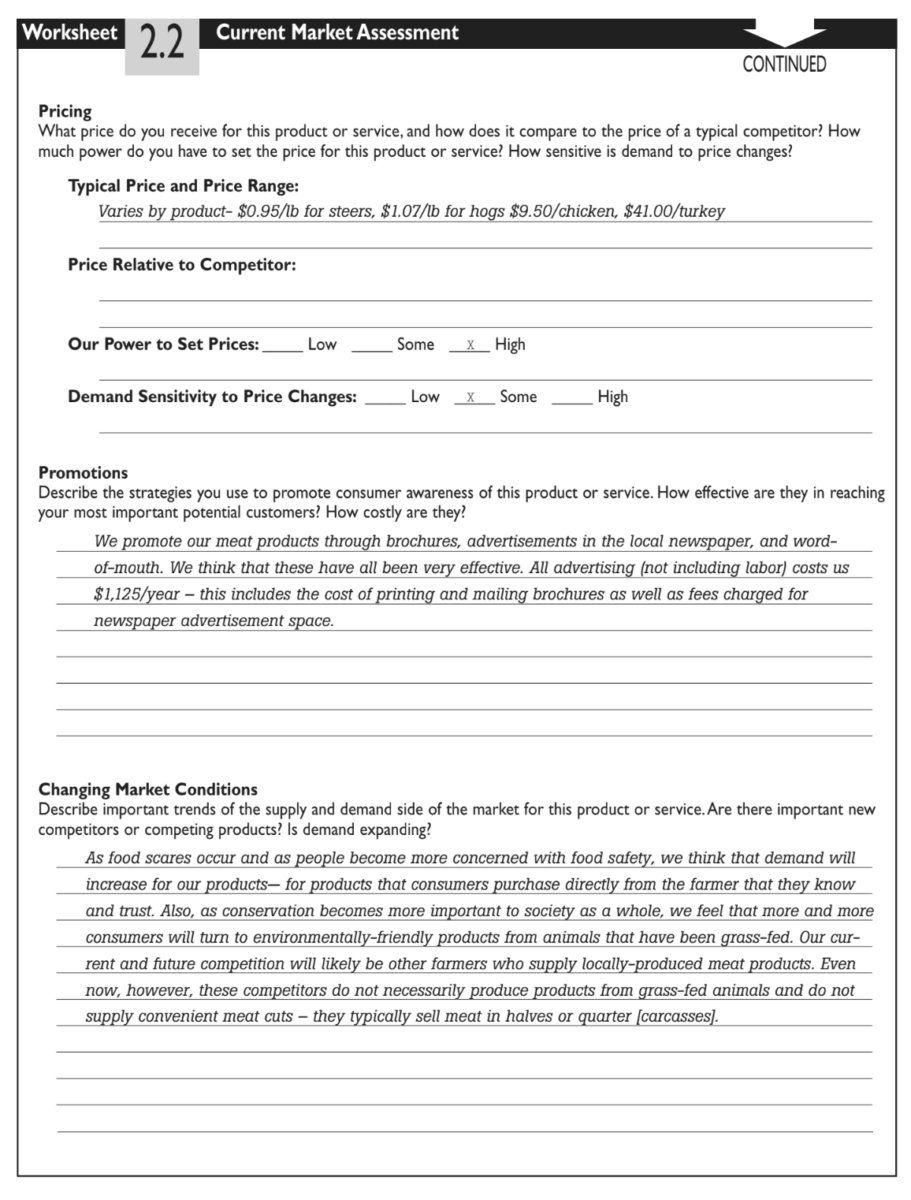
Dave and Florence Minar use a combination of brochures, advertisements and word-of-mouth to promote their meat products. They estimate their annual costs for promotions, excluding labor, to be $1,125—approximately 2.5 percent of their annual sales of these products.
In completing the “Promotions” section of Worksheet 2.2 (download worksheets for task 2) for each of your products, list all the promotional strategies you use. Then assess how effective they are in reaching potential customers (or in retaining current customers) and how much they cost. In other words, are your current strategies “paying their way”?
Market and Industry: How is our market changing?
Markets rarely stand still. On the supply side, new competitors might enter, while old rivals go out of business. On the demand side, the introduction of new substitute products might reduce demand for your product or new research might make it possible for you to make a health claim that helps you expand demand for your product. In the longer term, broad trends in customer and competitor demographics, technology and government policy can transform the size and structure of your market. The last step in assessing your current marketing strategies and activities is to look ahead to evaluate their potential for change.
Dave and Florence Minar observed that growing concerns over food safety and interest in more environmentally friendly farming practices should have positive impacts on the market for their meat products. They also noted that price premiums for locally produced meat products are attracting competitors. Still, Dave and Florence believed their grass-based production system and their attention to supplying convenient products would help them sustain their competitive advantage.
Be sure to consider a wide range of potential changes to your market as you complete the “Changing Market Conditions” section of Worksheet 2.2 (download worksheets for task 2) for each of your products. Often when we look back after experiencing a sudden, unexpected change, we realize that we could have seen it coming. Questioning even the most long held assumptions about your markets can help you identify issues that need to be addressed as you develop a business plan for the future.
Operations Situation
Before planning for the future, it’s important to step back and assess the resources available to your farm operation and the enterprises in which you use those resources. In this section the focus is on physical resources. Later, you’ll assess the human and financial resources of your business.
The assessment of physical resources and farm operations should answer the following questions:
- Resources: What physical resources are available for our business?
- Production: What production systems are we using?
- Management: What management systems do we have in place to support our business?
You’ll use Worksheets 2.3 through 2.6 (download worksheets for task 2) to record your answers as you work through this section. These Worksheets are designed for use in a farm business, but the fundamental questions are the same for any business and can be adapted for use by nonfarm rural businesses.
What physical resources are available for our farm business?
Physical resources include land, buildings and other structures, machinery and equipment, and breeding livestock and poultry. These are the tangible assets that you use to produce the products you market. Clearly the quantity and quality of the resources you control affect your current operations and influence your future opportunities. In addition to listing your physical resources, it is also important to note institutional restrictions on their use, including long-term leases, easements, conservation agreements, and other arrangements that must be honored in future years.
A farm map can be a good tool to use to describe your land resources. For example, Frank Foltz used a map (Figure 8) to describe the existing layout of Northwind Nursery at the start of his business planning process.
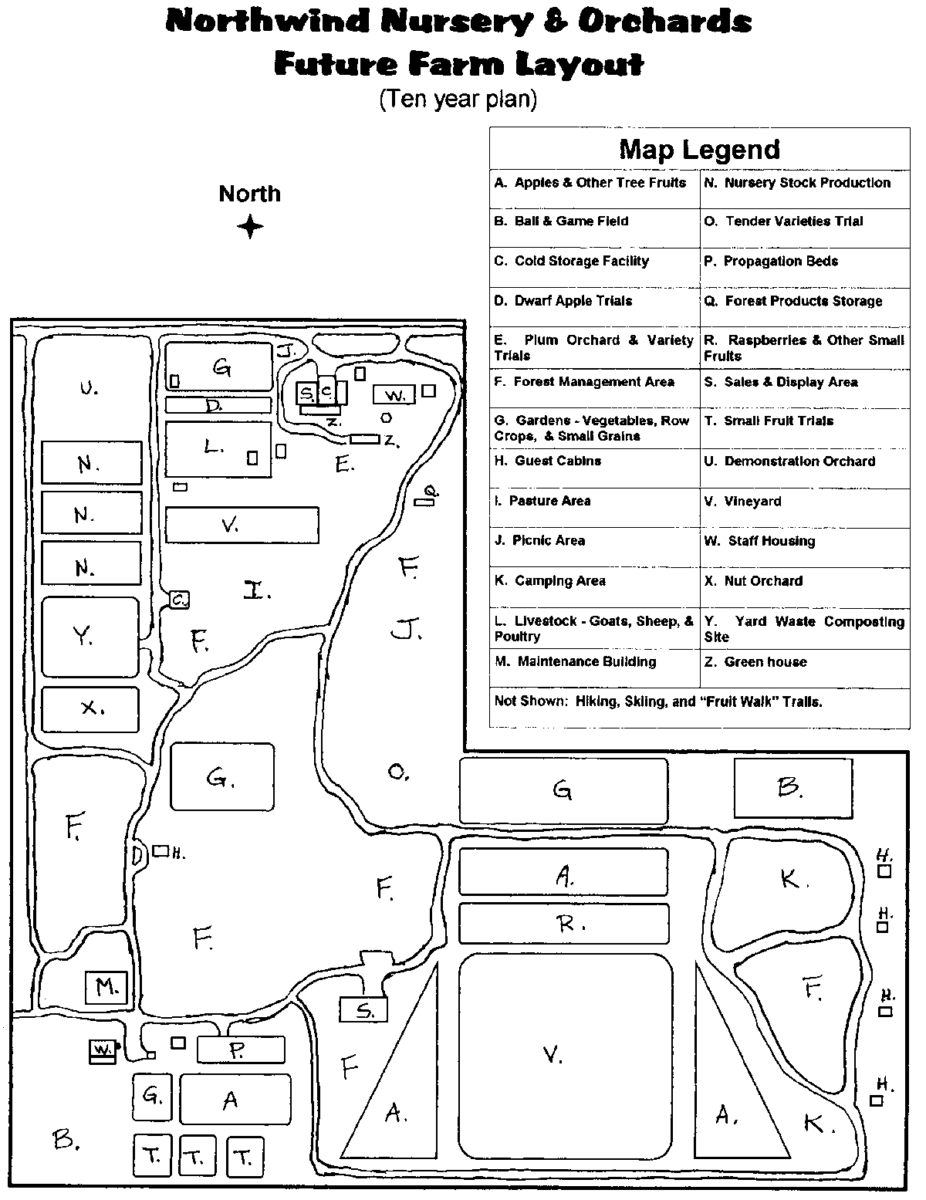
Your map should be drawn approximately to scale showing the size and configuration of important physical features on your farm, including fields used for crop production, pastures, woodlands, lakes, ponds and streams. Contact your local United States Department of Agriculture Natural Resources Conservation Service (USDA-NRCS) agent for help in locating a good map of your land. The map should also show the location of man made features, including the farmstead, permanent fence lines, the contours, grass waterways and irrigation wells. It may also be useful to show the location of crops currently on the farm, including perennial crops, such as alfalfa, vineyards and orchards. This provides a basis for planning the sequence of crops in rotation. Finally, if you rent land, draw a similar map for each rental tract. Then draw a smaller scale map that shows the location of your home farm and all the other parcels you farm.
Use Worksheet 2.3: Tangible Working Assets (download worksheets for task 2) to list the remaining physical assets on your farm. Buildings and permanent structures, machinery and equipment, livestock equipment and breeding livestock are the major categories. Focus your efforts on describing the major tangible assets that are important for your current operations or for activities you may consider in the future. Be specific in noting size, capacity, and condition when relevant.
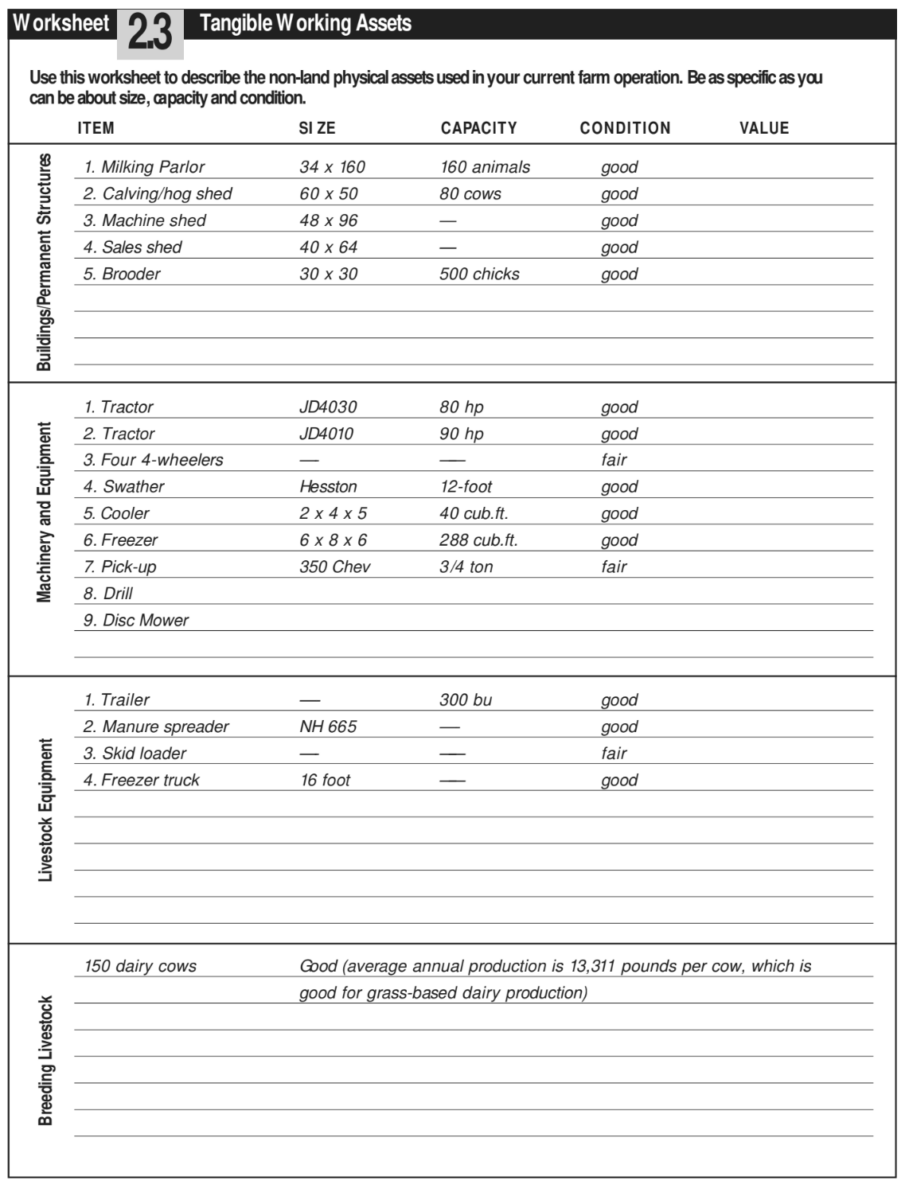
As noted in their farm history, Dave and Florence own 218 acres and lease another 65 acres that adjoin their property in New Prague, MN. They also own a 160-acre farm in McGrath, MN that they use for young stock production. The Minars’ list of machinery and equipment is smaller than that of most farms, since they do not raise row crops.
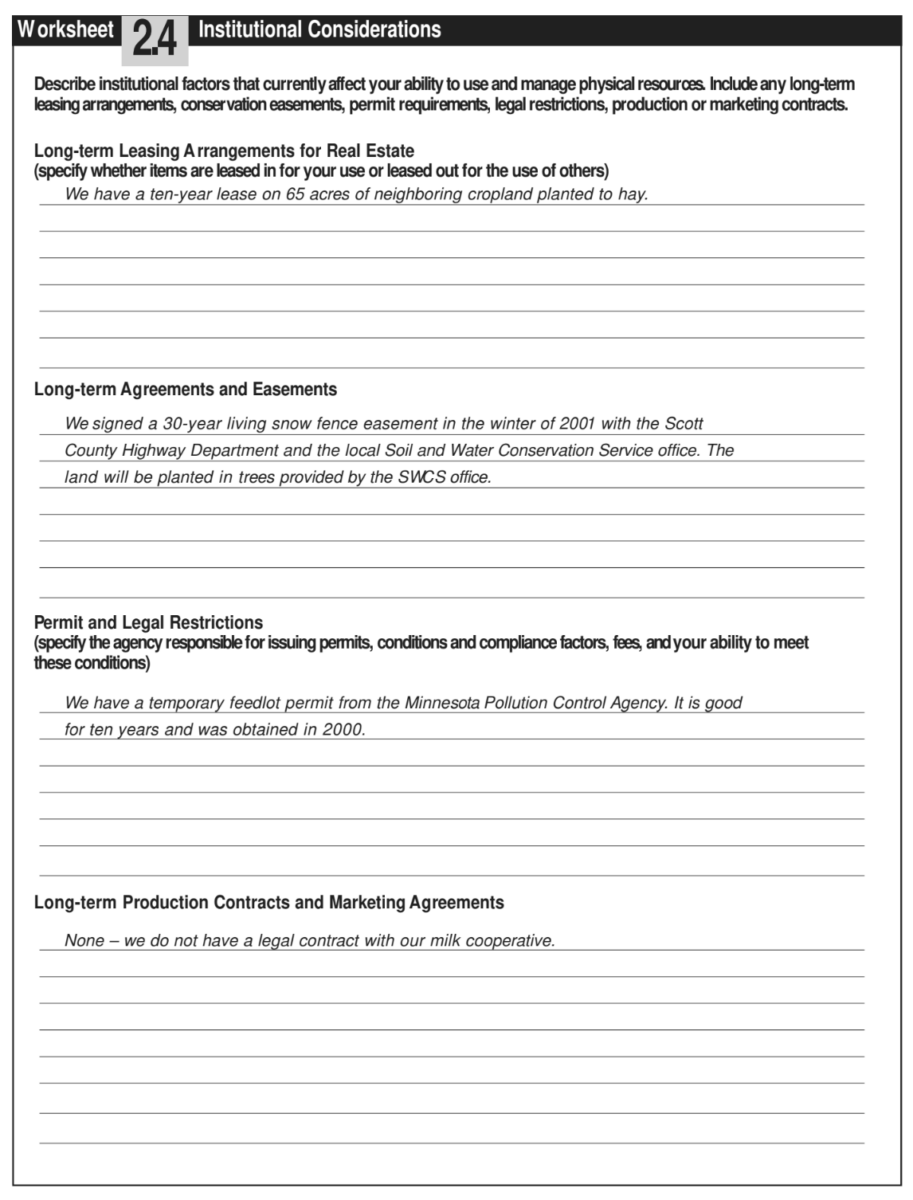
Laws and regulatory policies affect business operations. In addition, opportunities to market through long-term contracts and value added cooperatives may represent important institutional considerations in planning your operations. Use Worksheet 2.4: Institutional Considerations (download worksheets for task 2) to record the important existing institutional restrictions that must be considered in developing your operations plan. These include long-term leasing arrangements for land and other real estate, as well as any leases in effect with state and federal agencies. It is also important to note any long-term contracts for marketing crop and livestock products, whether they represent an opportunity to market or a commitment that must be fulfilled.
Dave and Florence Minar used Worksheet 2.4: Institutional Considerations, to record information about their lease for 65 acres of neighboring cropland and the 30-year living snow fence easement they recently signed. They also noted that they have a temporary feedlot permit that will be good until 2010. Since these institutional considerations will be in effect for many years to come, the Minars didn’t need to be concerned about being forced to make major changes in their grass-based dairy operation in the near future.
| Crop Enterprise Checklist | Crop Enterprise Checklist |
| Seed, seed stock, plants, seedlings, etc. | Feed, minerals, and feed additives (by type) |
| Fertilizer used (by blend or by total N, P, K etc.) | Forage (by type) |
| Chemicals (by type; application costs must be separable) - herbicide, insecticide, fungicide, growth regulators, harvest aids | Animal health/performance - veterinary services and medicines, pest control/chemicals, expendable health equipment and supplies |
| Custom services (by type) - conservation consulting, dues, freight | Breeding costs - bull, boar, ram, stallion fee (or maintenance cost), Al charge including semen, estrus synchronization, pregnancy checking |
| Machinery - water (consider system efficiency, water district charges, taxes, and other expenses), fuel and lube, repairs | Machinery and equipment, including buildings - fuel/lube or utilities specific to the enterprise, repairs |
| Irrigation - water (consider system efficiency), water district charges, taxes, and other expenses, fuel and lube, repairs | Labor |
| Utilities (enterprise-specific) | Grazing fees |
| Labor | Land rental |
| Miscellaneous crop-specific supplies | Pasture maintenance (seed, fertilizer, fencing, watering systems) |
| Crop insurance | Livestock-specific supplies (feed, bedding, veterinary) |
| Costs of accessing market | Marketing costs (commissions, promotion, packaging) |
| Checkoff/assessment (involuntary) | Hauling/transportation (if not reflected in prices used) |
| Shipping/transportation | Checkoffs/assessments (involuntary) |
| Storage/processing | Livestock purchased for resale |
| Building space required |
Figure 11. Crop Enterprise Checklist. Figure 12. Livestock Enterprise Checklist
What production systems are we using?
Now that you have described the physical resources you use in your current operation, the next task is to describe the current production systems in which you use those resources. This involves describing the crop rotations, timing of operations, the machinery and other inputs used, the quantity of production, and how your production is stored, processed and delivered to the market.
For crop production, this process can usually be accomplished most easily by thinking through the sequence of activities involved and carefully noting the machinery used, operational inputs such as seed and fertilizer applied, and the labor requirements. Refer to the Crop Enterprise Checklist (Figure 11) for items that should be included. Use Worksheet 2.5: Describing Crop Production Systems (download worksheets for task 2) for each of the major crop enterprises in your current operation.
The Worksheet 2.5: Describing Crop Production Systems (download worksheets for task 2) Dave and Florence Minar completed for pasture shows that maintaining 240 acres of pasture (the primary source of feed for their cows) requires one hour of labor per acre each year, as well as 20 pounds of seed, three gallons of fuel and seasonal access to the tractor, drill, disc mower and manure spreader.
As a livestock producer, particularly a grazier, this assessment may be a good opportunity to also evaluate the sustainability of your livestock operation. You can use the Beef or Dairy Sustainability Checklists that are available free from the Appropriate Technology Transfer for Rural Areas Center (www.attra.org). Both resources provide a series of questions regarding herd health, nutrition, productivity and pasture composition. The questions are designed to help you evaluate your current operations (see “Resources”).
While it is critical to describe each crop and livestock enterprise separately, it is also important to consider how they fit together. Otherwise, a change in one enterprise may have unintended consequences for other parts of the operation. Do you feed crops produced on your farm to livestock? Do you use manure from a livestock enterprise as an input in one or more of your crop enterprises? Are there significant bottleneck or slack periods in the annual calendar for your farm?
Use Worksheet 2.7: Enterprise/Calendar Matrix (download worksheets for task 2) to describe the links among the major enterprises in your farm operation. The Minars’ peak labor demand months are April and May and September and October. Note that the hog, beef and poultry enterprises fit in well with their dairy operation, since most of the labor requirements for these enterprises are concentrated in months after calving when the dairy cows are out on pasture.
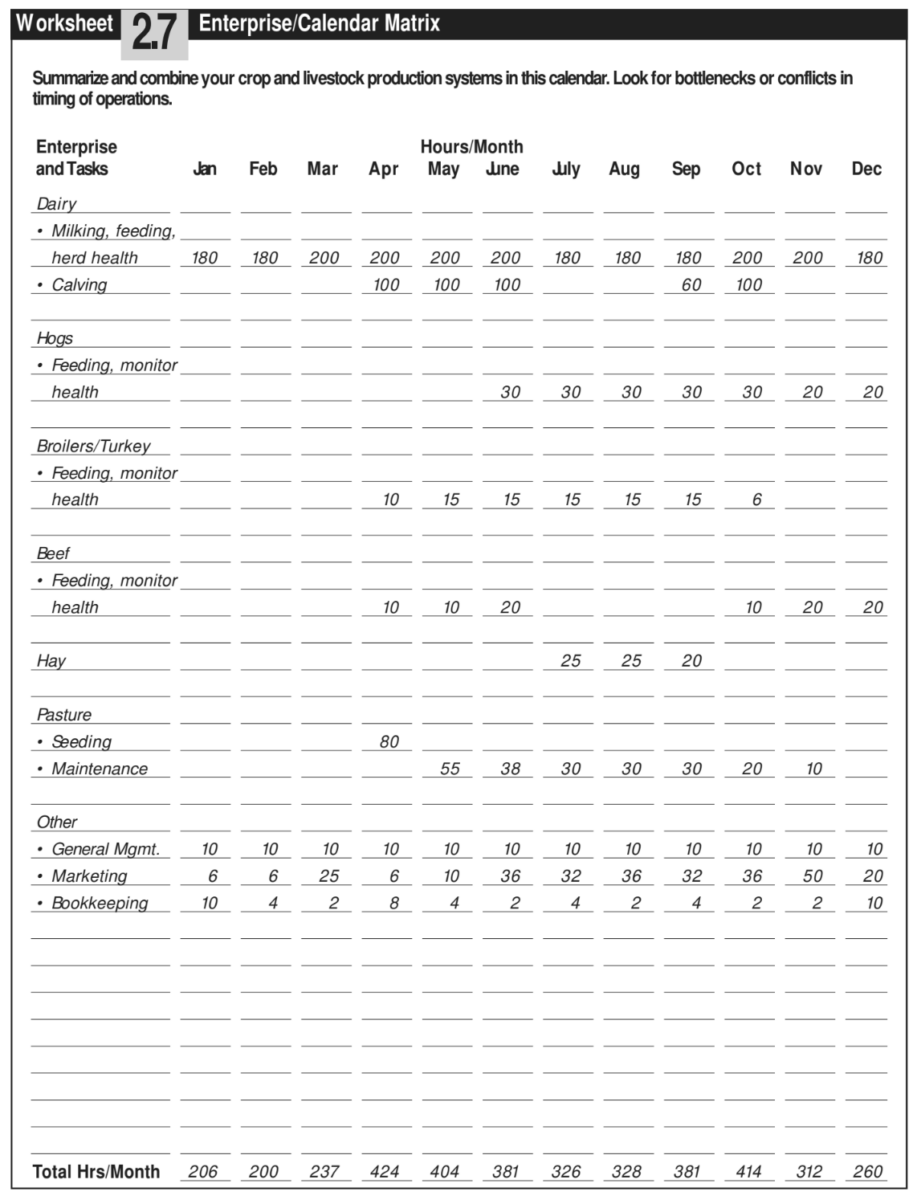
As you think about individual enterprises and the annual calendar of activities for your own operations, keep the big picture in mind and look at the synergies and conflicts between enterprises. Think hard about whether you are using your physical resources as efficiently as possible.
What management and management information systems do we have in place to support our farm operations?
The knowledge embodied in sound management practices and the information contained in good production records are also important resources for your farm operation. At the enterprise level, regular review of production records can help you spot problems before they become serious—helping you control costs and boost production. For example, the Minars regularly review milk quantity and quality reports from their local dairy cooperative to monitor their dairy enterprise. Through participation in a local Dairy Herd Improvement Association, they get more detailed information on each cow’s production. At the whole farm level, familiarity with annual planning and analysis can be an invaluable asset for an operation that is poised for making a major change. Regular meetings and discussions involving everyone in the operation are also valuable. The Minars have experience with using FINPACK3 for financial analysis and planning, and they have developed a habit of maintaining good communication among family members and their partner Paul Kajer. These skills—essential for dealing with the unexpected events that are sure to come with a significant business expansion—would be difficult to develop on an “as needed” basis.
Human Resources Situation
People are an essential resource in any farm business. Those who plan, manage and do day-to-day work may well be the most important factor in determining a farm operation’s success. The human resources base for your farm includes you and others in your family or household who contribute time and effort to the operation. It also includes full-time and part-time employees, interns, consultants you hire to provide specialized advice or expertise, and other resource providers such as local production specialists or neighbors.
Your assessment of your farm’s human resources should answer the
following questions:
- Current Work Force: Who is involved in our business and what roles do they play?
- Skills: What are our unique skills? What skills do we lack?
- Change: Will our labor situation change in the near future? Will someone enter or leave the operation? Use Worksheets 2.8 and 2.9 (download worksheets for task 2) to record your answers as you work through this section.
Current Work Force: Who is involved in our business and what roles do they play?
The best place to start an assessment of your current human resources situation is with a straightforward listing of all the people involved in your operation and the roles they play. This sounds simple, but it can provide some eye-opening insights on how you have organized decision making and work responsibilities. A simple matrix with a column for each major enterprise or activity and a row for each individual is an effective way to structure this information.
In their Worksheet 2.8: Human Resources Matrix, the Minars have drafted a brief description of duties and responsibilities in the cell for each enterprise in which that individual is involved. For example, Paul Kajer has major management and labor responsibilities for the dairy enterprise. He also works closely with Dave in the pasture enterprise and with Dave and Dan in the hay enterprise. Note that the Minars have included general management as a separate enterprise. In doing so, they recognize that there are important tasks associated with managing and coordinating the entire operation. Also note that they have included the dairy technician from their local cooperative and their farm business management advisor in their human resources matrix. Though not employed directly by Cedar Summit Farm, both provide important expertise and advice.
A quick glance at this matrix indicates the degree of specialization and the extent of teamwork within the operation. Paul, Dave and Ryan specialize and work together in the dairy, pasture and hay enterprises. Dave and Florence work together in the meat marketing enterprises. Also, the fact that Dave is involved in all the enterprises means that he plays a key role in coordinating activities for the entire operation. Finally, note that this matrix can help identify enterprises that depend almost entirely on one person (a column with only one completed cell) and people who may be overloaded and spread too thin (almost every cell in a row has an entry).
Use Worksheet 2.8: Human Resources Matrix (download worksheets for task 2) to sketch a clear picture of your current human resources. Also, look back to your completed Worksheet 2.7: Enterprise/Calendar Matrix to describe the seasonal pattern of activities across all your enterprises. Are there critical times of the year when more work could be shared? Are some people in your operation over- or under-employed? Looking back to the Minars’ Enterprise/Calendar Matrix, April through November are busy months, as they are for most farm operations in the Upper Midwest. The Minars use a summer student worker to add labor during some of these peak months. Adding total labor hours from the enterprise/calendar matrix across all twelve months, the Minars estimate their total labor demand to be 3,873 hours. Assuming a full time worker contributes 2,000 hours of labor per year (forty hours per week for fifty weeks), this translates to just under two “full-time equivalent” workers.
Skills: What are our unique skills? What skills do we lack?
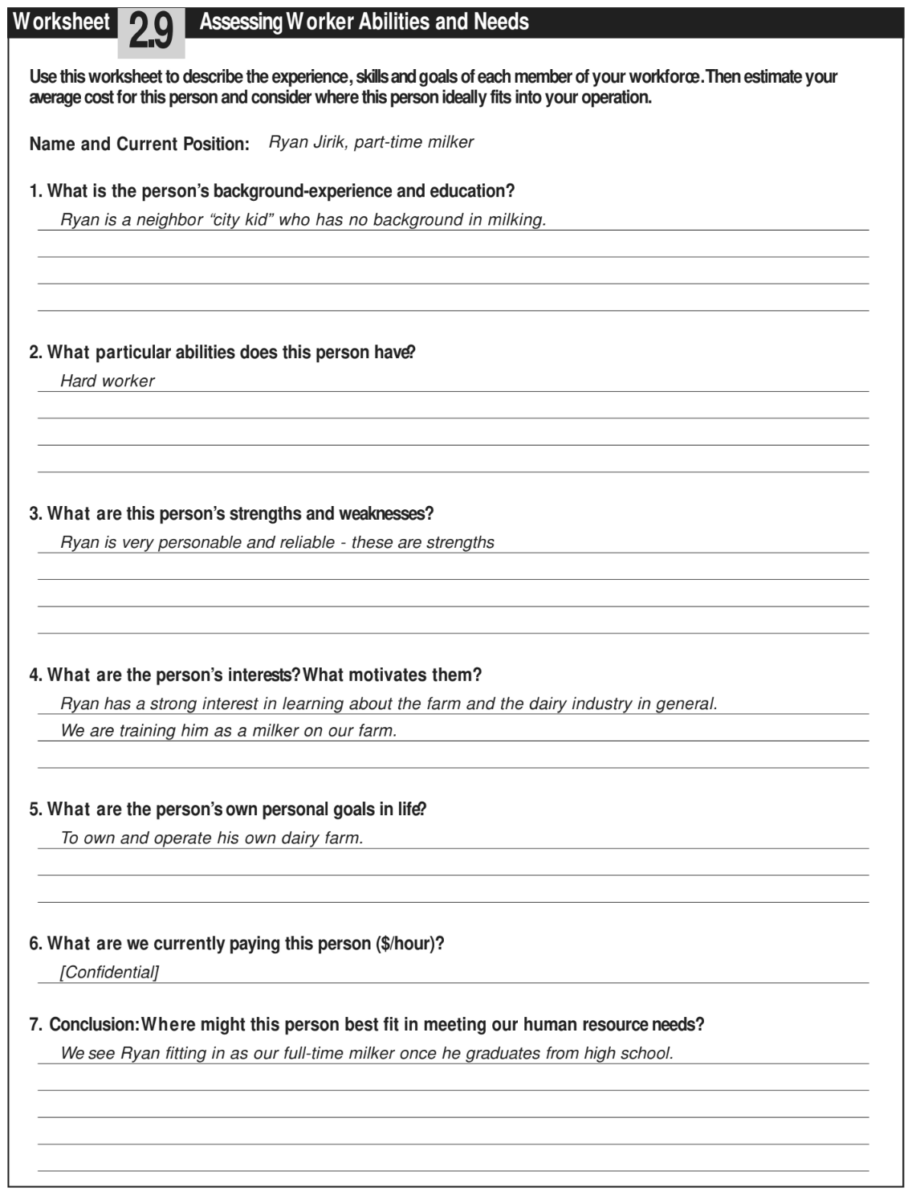
Worksheet 2.8: Human Resources Matrix describes the current pattern of decision and work responsibilities, but it is also important to assess how well suited each individual is to the roles he or she plays in the operation. Worksheet 2.9: Assessing Worker Abilities and Needs (download worksheets for task 2) guides you through a simple evaluation of an individual’s abilities and needs. Fill out a copy of this Worksheet for each person in your operation. You may want to have some or all of your team members complete their own assessment form as a way of identifying untapped skills. You may not be aware of a particular talent or skill that someone on your team has developed. A completed Worksheet 2.9 for Ryan Jirik, the Minars’ part-time milker, follows as an illustration. Note that Ryan’s long-term goal is to own and operate his own dairy farm, and the Minars are considering hiring him as a full time milker on Cedar Summit Farm when he graduates from high school.
As you review these Worksheets for people involved in your operation, ask whether there are people in your operation who have unique but untapped skills or critical skills that you are lacking. Also ask whether there are people who would be happier in other roles. These are opportunities or problems that can and should be addressed in developing your business plan.
Change: Will our labor situation change in the near future? Will someone enter or leave the operation?
A significant change in the lives of people involved in a farming operation is often the factor that motivates the development of a new business plan. Dave and Florence Minar were motivated to explore on-farm milk processing, in part, as a way to create opportunities for their children to join the operation. Frank Foltz began to consider selling the catalog sales part of his business shortly after two daughters had married and moved away from home.
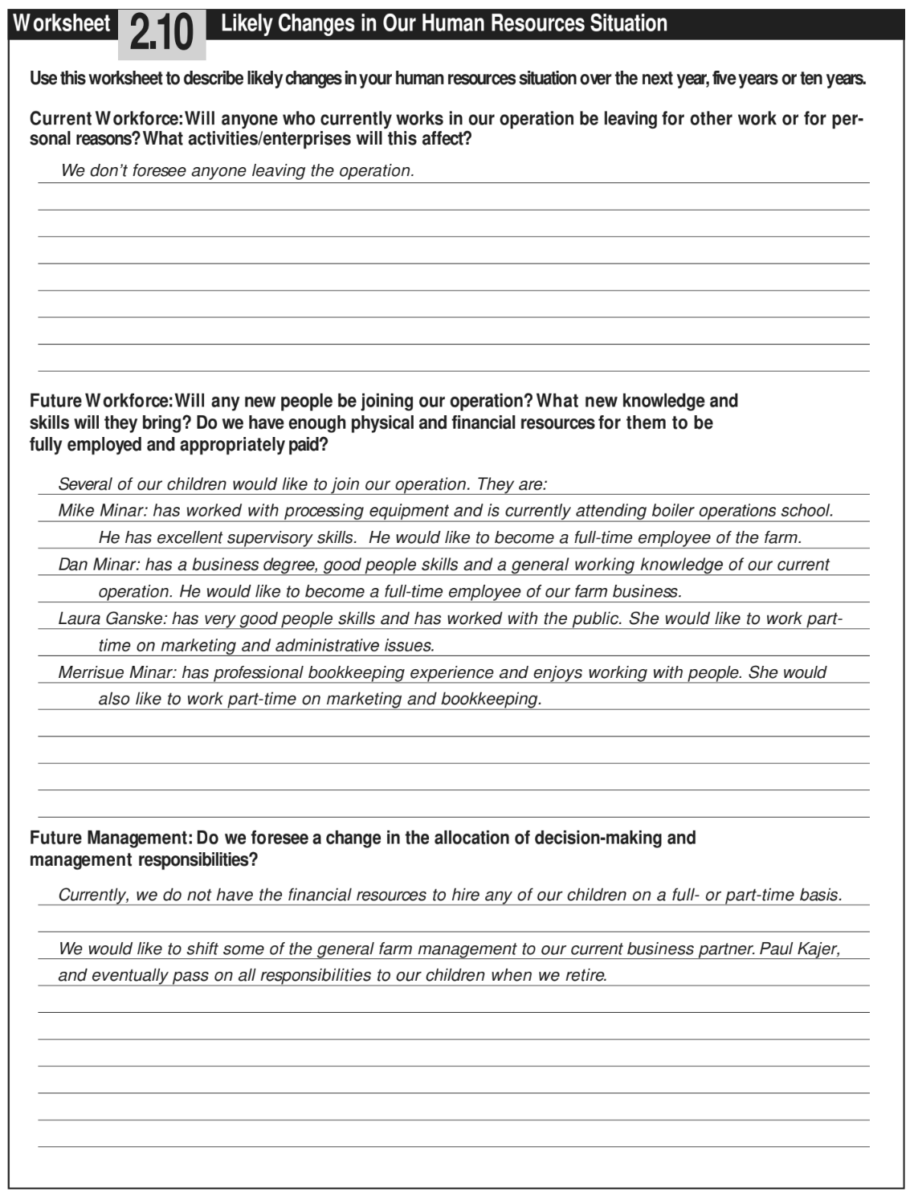
Now that you have described your current human resources situation, spend some time thinking systematically about how that situation may change in the next year, five years or ten years. Worksheet 2.10: Likely Changes in Our Human Resources Situation (download worksheets for task 2) poses questions about three of the most common and most significant human resources changes in farm operations. The first two questions focus on people who will be leaving or joining the operation and the opportunities and challenges created by these changes. The third question focuses on a difficult issue in many family farming operations—the transfer of managerial responsibilities from one person to another. One or more of these questions may be relevant for your operation—or you may face some other important human resources change. Careful attention to potential changes, whatever they may be, will help you clarify the issues that need to be addressed by your business plan.
Financial Situation
Detailed information on current finances is a key component of any business plan, particularly if it will be used to generate outside resources in the form of loans or equity investments. While many of your personal goals cannot be expressed in monetary terms, a certain level of financial planning is necessary for a farm operation to be viable in the long term. An accurate assessment of your current financial situation provides a comprehensive summary of the value of the physical resources available to your operation. It also shows you the income being generated by those resources in combination with human resources through your operations and marketing strategies. In addition, the strength of your financial position will determine your ability to access the capital resources you will need to add and use new resources in your operation.
Your assessment of your farm’s financial resources should answer the following questions:
- Financial needs: What are our current family living expenses?
- Financial performance: How well has our business performed in the past, and how strong is our current financial position?
- Risk: What type of risk is our business currently exposed to?
- Financial environment: What is our current business environment, and how is it changing
Use Worksheets 2.11 through 2.15 as a guide for recording your answers as you work through this section.
Financial Needs: What are our current family living expenses?
If you and your family rely on your farm business as your only source of income, or as a major source of income that is supplemented by earnings from off-farm work, your operation can only be sustainable in the long run if it provides enough income to meet your family’s basic living expenses. For most people, then, making a realistic estimate of current family living expenses is the starting point for assessing the financial status of your current operation.
Use Worksheet 2.11: Estimating Family Living Expenses (download worksheets for task 2) and Income Needs to estimate your annual family living expenses and your family’s earnings from off-farm work. The difference between the two is the amount of income you need from your farm operation.
If you do not maintain current records that can be used to estimate your family’s current and future living expenses, you may want to contact Minnesota’s Center for Farm Financial Management (CFFM). The CFFM maintains a database, called FINBIN, which tracks personal and household expenses for thousands of Minnesota and North Dakota farm families. Average Minnesota household expenses for 2001 are listed in Figure 19. Use the database averages if you do not have reliable family living expenditure estimates and adjust them according to your family’s needs. The FINBIN database is accessible through CFFM’s website (www.cffm.umn.edu/) or by contacting the Center directly. See “Resources” for more information.
Figure 19.
FINBIN Average Expenses for 2001 Farm Family in Minnesota and North Dakota
In the year 2001, family living expenses averaged $53,187 for 954 Minnesota and North Dakota farm families enrolled in the Farm Business Management Program. According the Center for Farm Financial Management’s FINBIN database, the largest spending among farm house- holds was for food and meals, medical care and health insurance, household supplies, personal care, recreation, nonfarm vehicle expenses, taxes, real estate and other capital purchases.
Household and Personal Expenses: 2001
Number of farms: 954
Family Living Expenses (in dollars)
Food and meals expense: $5,590
Medical care and health insurance: $4,886
Cash donations: $1,337
Household supplies: $3,673
Clothing: $1,586
Personal care: $2,781
Child/Dependent care: $766
Gifts: $1,631
Education: $1,305
Recreation: $2,253
Utilities (household share): $1,654
Nonfarm vehicle operating expense: $2,489
Household real estate taxes: $172
Dwelling rent: $119
Household repairs: $1,101
Nonfarm interest: $873
Life insurance payments: $1,538
Total cash family living expense: $33,754
Family living from the farm: $356
Total family living: $34,110
Other Nonfarm Expenditures
Income taxes: $6,823
Furnishing & appliance purchases: $635
Nonfarm vehicle purchases: $3,320
Nonfarm real estate purchases: $3,060
Other nonfarm capital purchases: $2,901
Nonfarm savings & investments: $2,695
Total other nonfarm expenditures: $19,433
Total cash family living investment & nonfarm capital purchases: $53,187
Financial Performance: How well has our business performed in the past, and how strong is our current financial position?
Your ability to assess the past financial performance of your farm will depend on the financial information that you have available. If you have access to detailed past financial information on your farm business, the process may be one of laying past years’ information side by side in a trend analysis. If you do not have access to much past financial information, you may be limited to comparing information from past tax schedules. Although this approach of comparing tax records is widely used by financial institutions to assess financial performance, it violates one of the primary requirements of a complete financial analysis—that the analysis should be completed based on accrual, not cash, information.
Why accrual? The figure below compares financial results for a hypothetical operation based on tax information vs. accrual income information. This illustrates how easy it is to underestimate financial progress if you look only at the Schedule F (tax) information. One of the reasons for this is that U.S. farmers enjoy the unusual ability to report taxes on a cash rather than accrual basis. Most farmers find ways of continuously pushing income forward, consistently building inventories and underrecognizing income on their tax statements. So, by using the traditional method of many financial institutions of laying several Schedule F’s side by side, you are likely to underestimate the financial progress you have been making. On the other hand, you could be overestimating performance if assets are being used up and not replaced.
Figure 20. Comparison of Financial Results Based on Tax and Accrual Information
| Schedule F | Accrual | |
| Gross cash farm income | $123,720 | $123,720 |
| Cash farm operating expenses | $-108,564 | -108,564 |
| Accrual adjustment | ||
| Change in crop inventory | $16,298 | |
| Change in livestock inventory | $-3,656 | |
| Change in accounts receivable | $1,950 | |
| Change in accounts payable | $2,450 | |
| Total inventory change | $17,042 | |
| Depreciation | $-6,745 | $-6,745 |
| Net farm income | $8,411 | $25,453 |
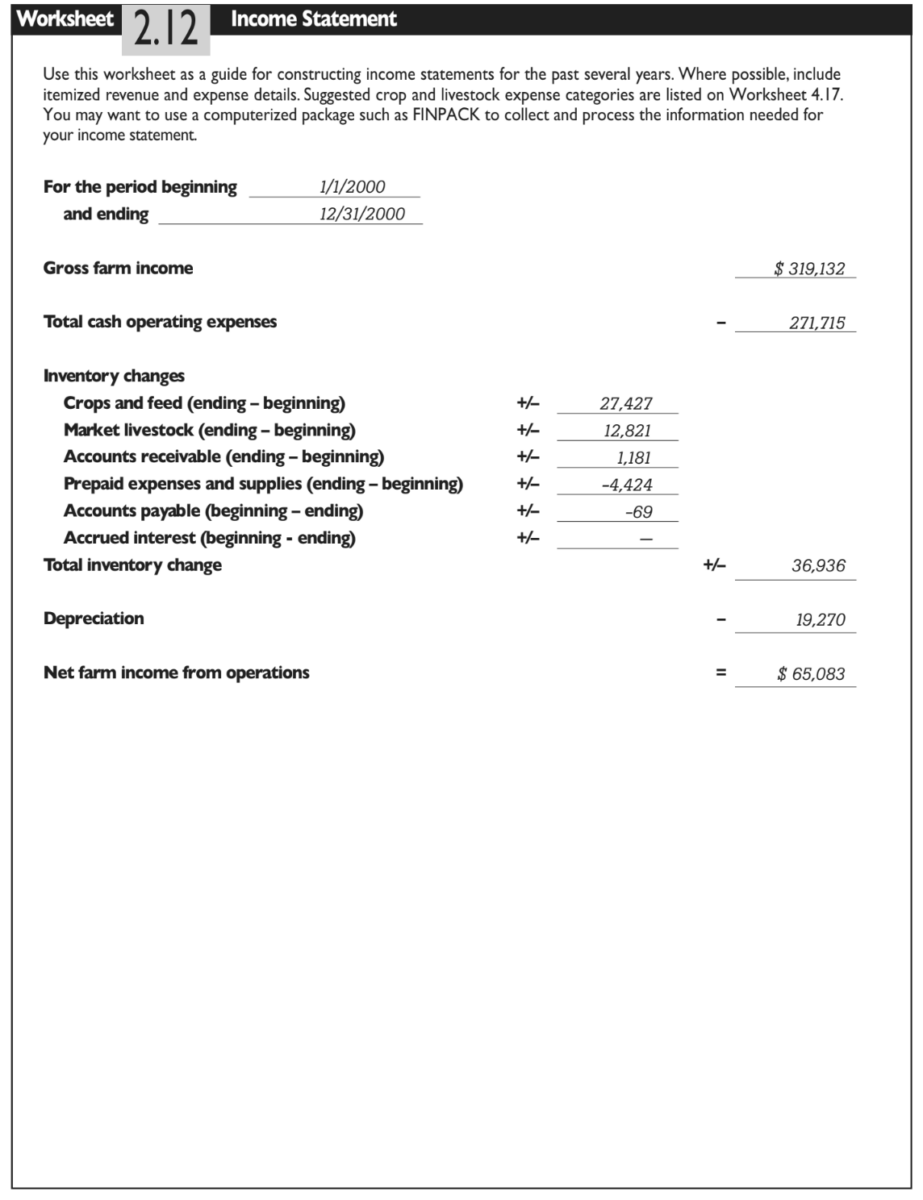
Looking ahead, the Minars’ Worksheet 2.12: Income Statement offers a real-life example of how tax information can underestimate financial performance. For 2000, they reported a net farm income of $28,147 on their Schedule F, but their net farm income calculated on an accrual basis was $65,083 (Numbers have been changed to protect confidentiality). So cash vs. accrual information is one of the first adjustments to consider when you begin to evaluate your past financial performance and consider accounting alternatives.
Another concern is market vs. cost asset valuation. Agricultural lenders have traditionally evaluated farm financial performance based on the market value of farm assets. This gives the lender a basis for evaluating the risk faced by the lending institution and the collateral available in case a borrower defaults on a loan. Market valuation of assets provides the information demanded by external users of your financial information. What about your situation? Do market values give you the information you need for internal evaluation of progress? Using market values mixes net worth growth from farm earnings with growth from “paper changes” in the value of assets. So if you lay out your financial history using market values for assets, you can never be quite sure how profitable your farming operations have been, or even if your farm has been profitable at all.
The figure below shows a comparison of the net worth picture for a hypothetical farm using cost vs. market values on assets. The cost column values assets at their original purchase cost minus depreciation. This results in a cost net worth, which reflects only what has been invested from outside the farm (contributed capital) and what has been earned and retained over time (retained earnings). The net worth on the market value side includes these earnings, but it also includes the accumulated changes in market values of all assets over time (market valuation equity).
Figure 21. Comparison of Net Worth Based on Cost and Market Values for Assets
| Cost Valuation | Market Valuation | |
| Total assets | $267,438 | $358,590 |
| Total liabilities | - $105,367 | - $105,367 |
| Contributed capital and retained earnings (a) | $167,071 | |
| Net worth or owner's equity (b) | $253,223 | |
| Market valuation equity (c) = (b-a) | $91,152 |
Look at the Minars’ sample Worksheet 2.13: Balance Sheet for a real life example of the difference between cost and market valuation. At the end of 2000, their net worth under cost valuation was $126,610, while it was $735,642 under market valuation (from Minars’ Worksheet 2.10: Income Statement—not shown for privacy reasons).
Figure 22.
Defining Financial Performance Measurement Areas
Profitability: Profitability evaluates just what you would expect—whether your business is making money. This sounds pretty basic, but it is probably the most neglected part of the financial evaluation process by farmers. Traditionally, farmers have prepared their financial information for lenders instead of for their own purposes. How many times has your lender asked you for an accrual income statement? Even if you evaluate several years of tax schedules, you may be missing the mark on how profitable your business has been.
Liquidity: Your business is liquid if you have available funds or can easily access funds to meet ongoing or unforeseen cash requirements. You may have a very liquid farm business even though you do not have a lot of cash in the bank if you have assets that can be sold and turned into cash easily, without interrupting the flow of ongoing business.
Solvency: Your business is solvent if it has an adequate net worth to make your farm attractive to lenders and others who you might want to invest in your business. Lenders want to lend you money. That is how they make their living. But they won’t be interested unless you have adequate assets relative to claims on the assets (debts). This makes lenders comfortable investing their assets in your farm business.
Repayment Ability: While liquidity evaluates the overall availability of liquid financial reserves, repayment ability looks more at whether your business generates enough cash to repay debt on time. It is closely related to profitability in that a profitable farm will usually generate sufficient funds for debt repayment. But repayment ability is also related to debt structure. If you have too much short-term debt, with high repayment requirements, even a profitable business may experience repayment problems. This is often a problem for farms that are growing rapidly. They may be very profitable, but they often need to plow their earnings right back into the farm during periods when debt repayment requirements are at their highest.
Efficiency: Efficiency is very closely related to the issues discussed in the section on operations. It measures how much income is being produced, how much it costs to produce it, and where the money is going. So, efficiency is where you should look if you are interested in evaluating cost control.
Market valuation is important if your goals include looking for external funds. Yet you should consider adding cost information to your analysis for your own evaluation of financial progress. These concepts (and the following financial performance measurement concepts) are explained in greater detail in Evaluating Financial Performance and Position, available through the Oklahoma Cooperative Extension Service.
Before going into the tools used in financial analysis, it may be useful to discuss the basic financial performance measurement areas of most businesses. The Farm Financial Standard’s Council (FFSC) has identified five financial measurement areas for farm businesses. They are no different than those sought by nonfarm businesses. However, some of these performance measurement areas have not been systematically analyzed in farming as in other businesses.
The five recommended financial performance measurement areas are:
- Profitability
- Liquidity
- Solvency
- Repayment Ability
- Efficiency
To get a complete look at the past financial performance of your farm business, you should prepare the following statements to evaluate profitability, liquidity and solvency: the income statement, the cash flow statement, the balance sheet, and the statement of owner’s equity. We will discuss the income statement and balance sheet in detail, since these are probably the most important for farm business analysis.
Income Statement. The income statement is a basic tool used to determine farm income for the past year; it shows whether or not your business has generated sufficient income to cover family living and tax expenses.
Worksheet 2.12: Income Statement (download worksheets for task 2) provides a basic structure for your income statement. Once again, the example provided here is based on the Minars’ FINAN analysis for 2000, although some numbers have been changed to protect their confidentiality.
Use Worksheet 2.12 to develop historical net farm income statements from your available records. Begin by listing gross revenue from market livestock sales, crop sales, services, government payments, insurance claims, patronage dividends, etc. Be sure to include any gains or losses from the sale of culled breeding stock, as well as the change in the quantity of raised breeding stock. Developing an Income Statement (available from Oklahoma Cooperative Extension Service) details how to calculate breeding stock gains and losses. Next, list all farm business expenses, including purchased livestock, changes in purchased feed inventories, accounts payable, non-current liabilities, and depreciation expenses. Your net farm income is equal to the value of gross farm revenue minus total farm expenses.
Balance Sheet. A balance sheet lists all business assets and liabilities, showing what is owned and what is owed. In other words, the balance statement depicts your claim to the business’ financial assets or what is called net worth and owner’s equity. A series of balance sheets prepared at the same time each year for successive years shows the change in the business’ financial position and the progress you have made. A balance sheet can also be used to make accrual adjustments to your income statement.
Assets include items owned by the business, such as land, machinery and breeding livestock, as well as items owed to the business. Liabilities include all claims against the business, such as accounts payable, credit card debt, the current portion of term debt, accrued interest on all farm loans, and taxes. Balance sheets typically break farm assets and liabilities into at least two categories. The FINPACK balance sheet, reproduced for this Guide in Worksheet 2.13: Balance Sheet (download worksheets for task 2), breaks farm assets and liabilities into three categories: current, intermediate, and long term. This allows for further analysis of the financial structure of the business.
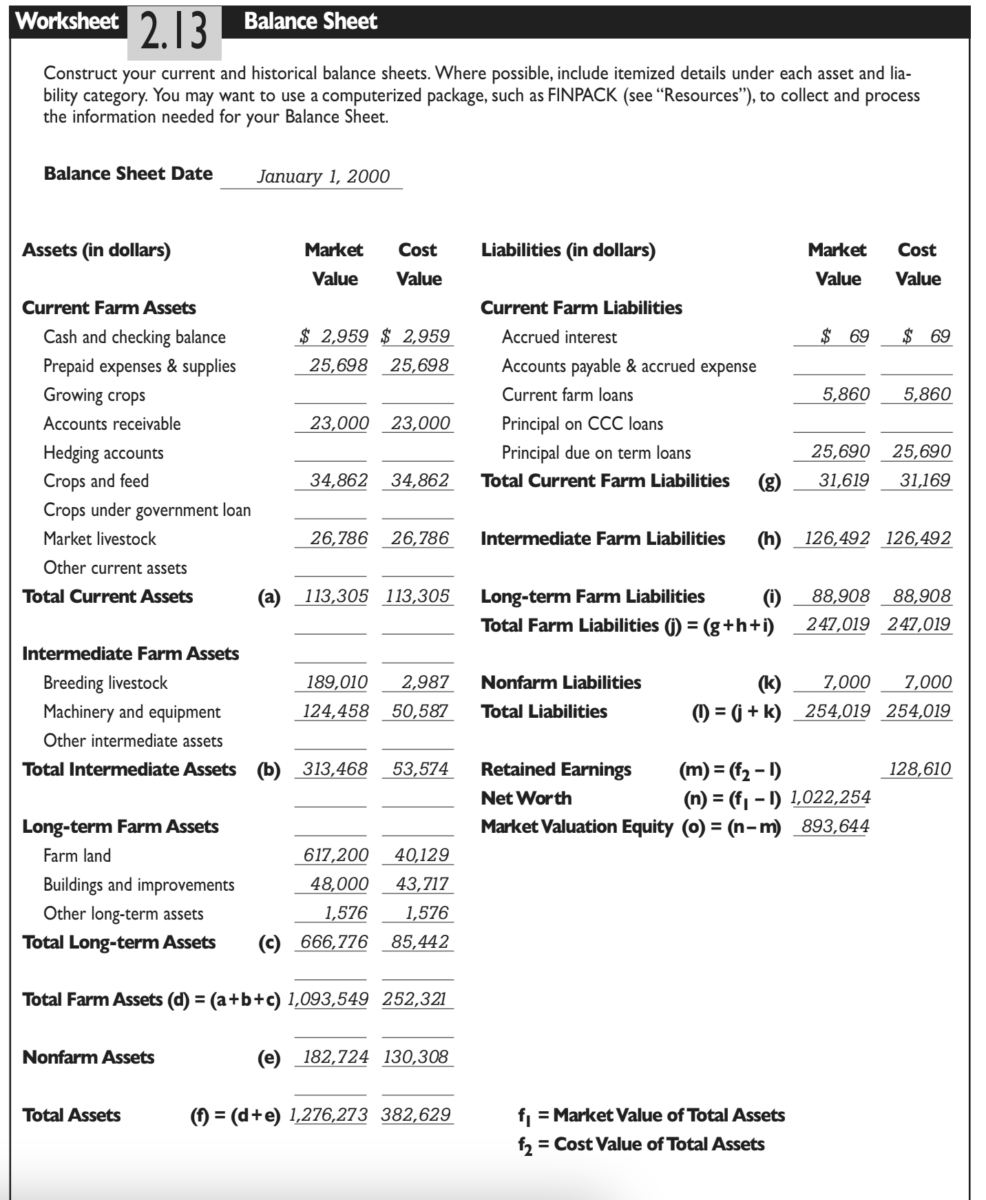
The example balance sheet provided the Worksheet 2.13 Example is based on the Minars’ financial analysis for 2000. In this example, the Minars’ assets are listed for cost and market values. The difference between the two values is quite dramatic $382,629 at cost versus $1,276,273 at market. As discussed earlier, if your balance sheets have been based strictly on market values, realize that not all of your net worth changes may have resulted from business earnings. Moreover, because farms and ranches typically are owner operated, it can be difficult to separate personal and business assets. If your business is a sole proprietorship and you have included nonfarm information on your balance sheet (like Dave and Florence Minar), be aware that net worth changes over time will reflect what was earned on and off the farm minus what was consumed in family living and taxes.
Use Worksheet 2.13 to reconstruct historical balance sheets for your business if possible. Divide your assets and liabilities into current (cash and other assets that are easily converted to cash or liabilities due within the current period), intermediate and long-term categories (items not normally for sale, but rather held for the production of livestock or crops and liabilities due beyond the current period). Then value your assets and liabilities using either the cost or market valuation method. Add assets and liabilities in the space provided and calculate your net worth.
For more information about balance sheets and how to construct them, see Developing a Balance Sheet from Oklahoma State University. You may also want to check out the FINPACK or Farm Biz computer software, which can walk you through the balance sheet input and provide the beginnings of computerized analysis for the farm business. See “Resources” for more information.
Once you’ve prepared historical balance sheets and income statements, your next task is to look at the value of retained earnings generated by the business if one of your goals is to increase owner equity over time. Retained earnings can be estimated using the earned net worth change calculation. The earned net worth change is calculated by adding all nonfarm income to net farm income. Family living expenses, partner withdrawals and taxes are then subtracted to arrive at a value that represents income that either contributed to or depleted the farm’s net worth in the given period. This simple calculation is depicted in Figure 25, Worksheet 2.14: Earned Net Worth Change Analysis (download worksheets for task 2).
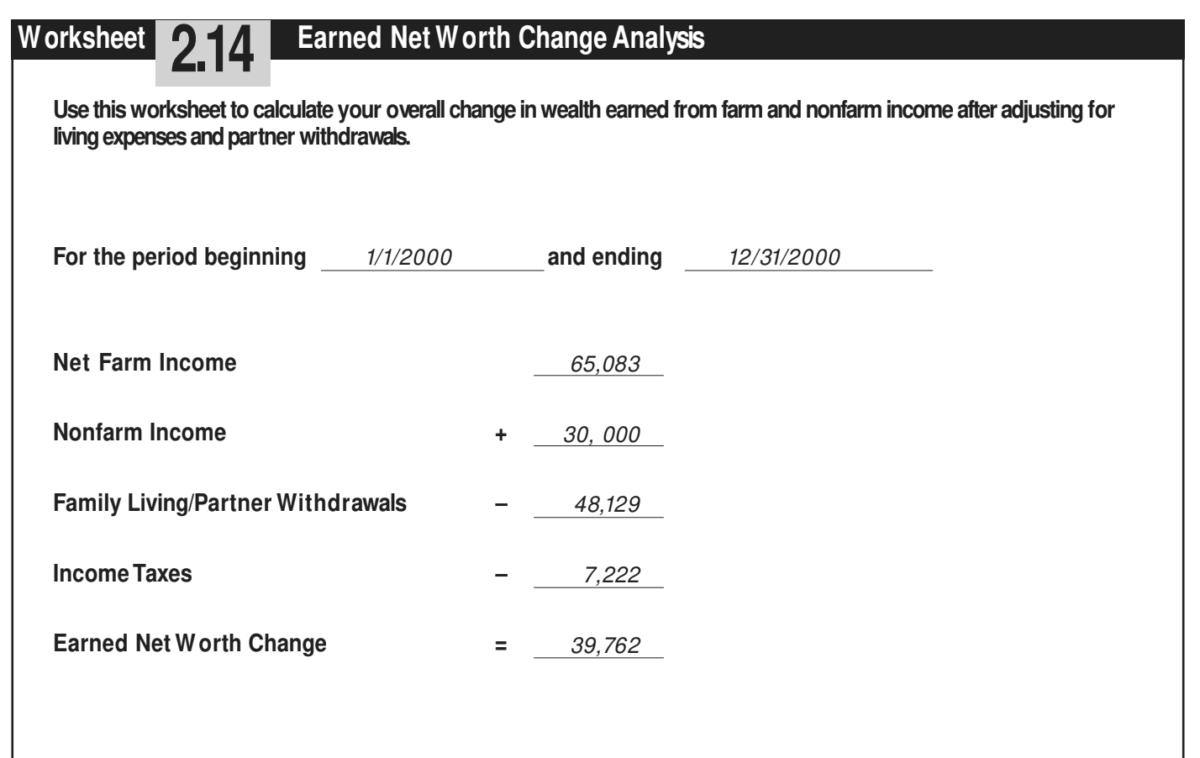
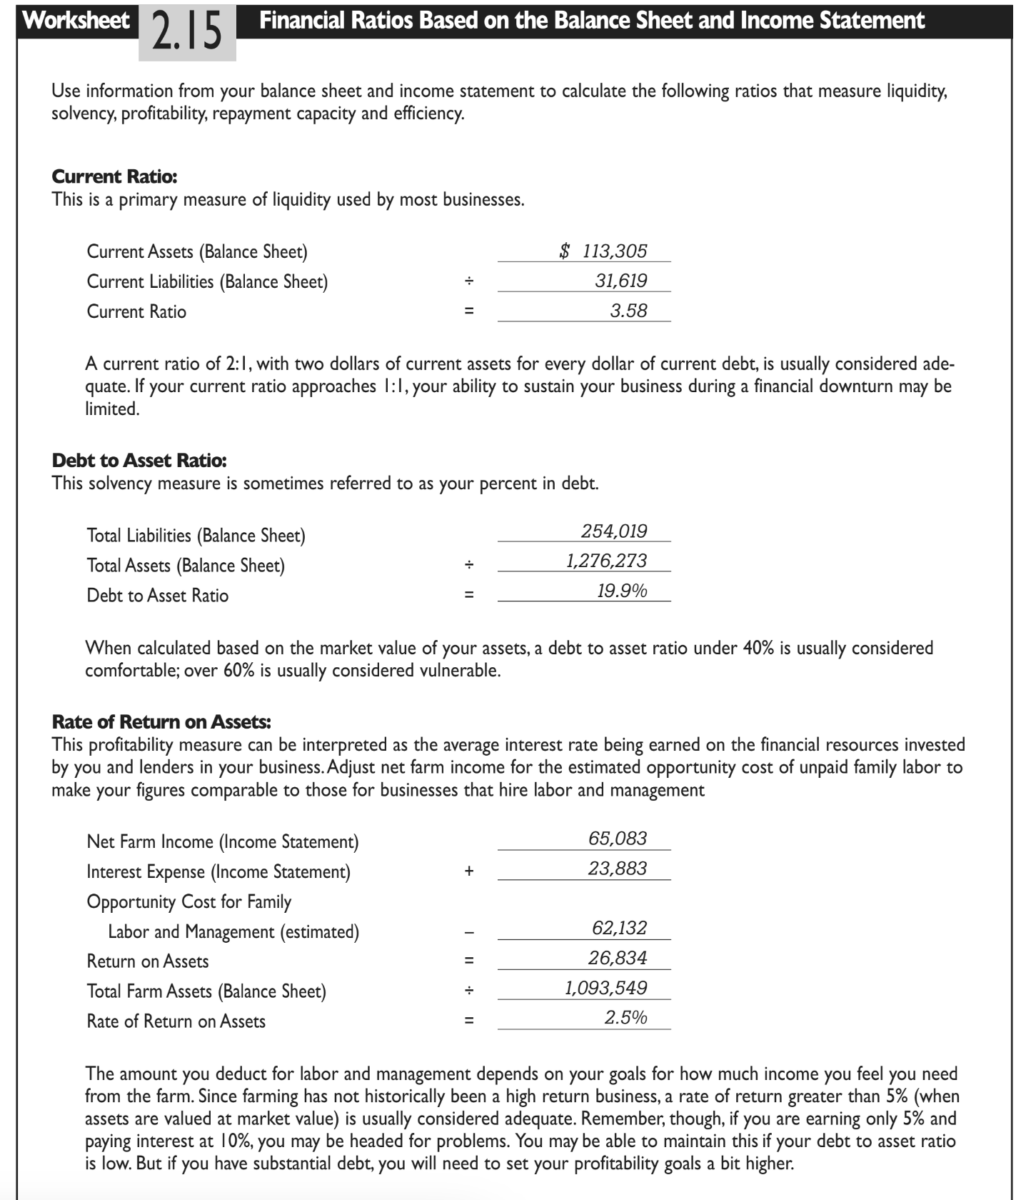
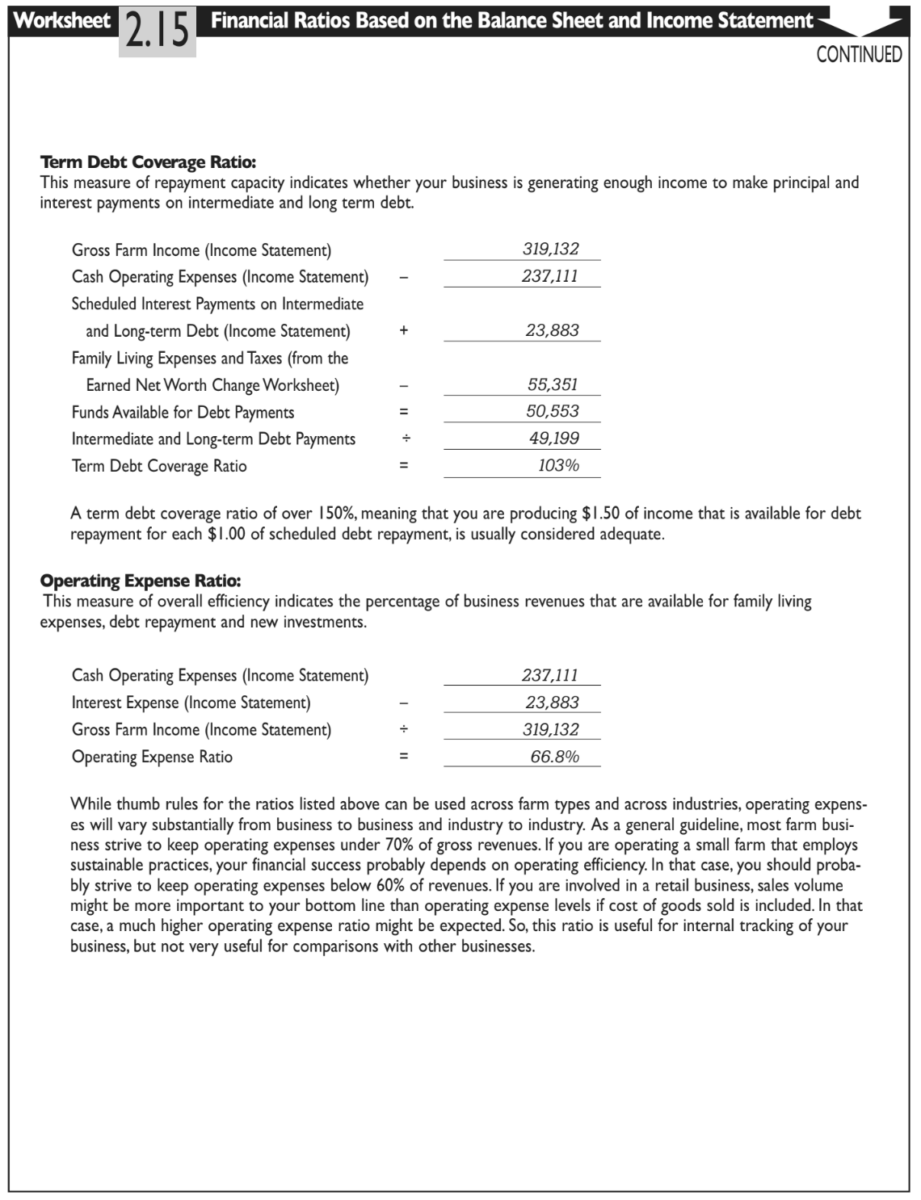
Note that for family farms, the earned net worth calculation includes non- farm components since the nonfarm withdrawals for family living purposes are the primary draw on income and because net worth growth can occur by bringing in income from off the farm, cutting living expenses, or improving tax management. The national Farm Financial Standards Council (FFSC) has identified 16 measures, or “ratios”, around the five basic financial performance area measures (liquidity, solvency, profitability, repayment capacity and efficiency). Ratio analysis is a tool financial management experts and lenders use to judge the absolute and relative strength of a business. A full description of the FFSC’s “sweet sixteen” financial ratios and their calculations are listed in Appendix B. Space is not devoted here to do a complete ratio analysis because it requires very detailed farm records. If your records contain the information needed to calculate each of the financial ratios mentioned, we highly recommend doing so. This will help you pinpoint your business’ financial strengths and weaknesses. Using numbers from your Balance and Income Statements (Worksheets 2.12 and 2.13), you can calculate five of the sixteen ratios as illustrated on Worksheet 2.15: Financial Ratios Based on the Balance Sheet and Income Statement (download worksheets for task 2).
There are many other ways to measure financial performance. For small farms that are built around the use of family labor instead of vast amounts of capital, you might want to track labor and management earnings. This measure recognizes that net farm income for a family farm represents returns to unpaid labor, management and equity capital. To estimate labor and management returns, an opportunity cost for owners’ equity is subtracted from net farm income. The remainder is labor and management earnings. Labor and management earnings can be directly compared to your desired amount of family income from the farm.
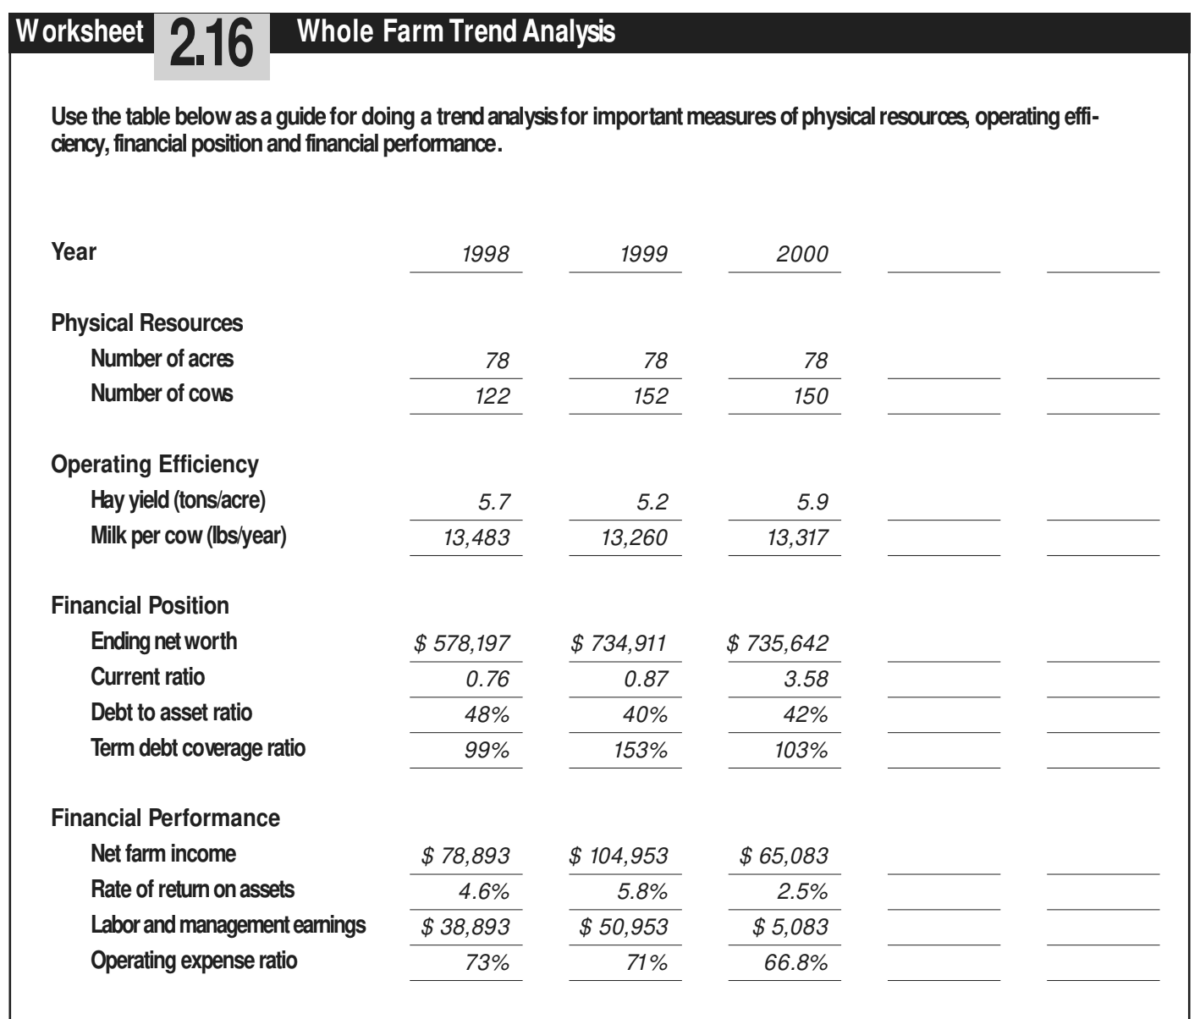
Regardless of which method you use to evaluate past financial performance, you will find it useful to incorporate all this financial information into a trend analysis. This enables you to put everything together and document a financial history for yourself and for external stakeholders. Worksheet 2.16: Whole Farm Trend Analysis (download worksheets for task 2) can serve as a guide for your own whole farm trend analysis, which should include measures of physical resources, operating efficiency, financial position and financial performance that are most relevant for your farm business. A trend analysis for the Minars’ operation is provided as an example.
Regardless of which method you use to evaluate past financial performance, you will find it useful to incorporate all this financial information into a trend analysis. This enables you to put everything together and document a financial history for yourself and for external stakeholders. Worksheet 2.16: Whole Farm Trend Analysis can serve as a guide for your own whole farm trend analysis, which should include measures of physical resources, operating efficiency, financial position and financial performance that are most relevant for your farm business. A trend analysis for the Minars’ operation is provided as an example.
Assess your current situation in:
Marketing
- Product
- Customers
- Unique Features
- Distribution
- Pricing
- Promotion
- Anticipated Marketing/Industry Changes
Operations
- Physical Resources
- Prodocution Systems
- Management Systems
Human Resources
- Work Force
- Unique Skills
- Anticipated Changes in Work Force
Finances
- Needs
- Performance
- Risk
- Financial Environment and Anticipated Changes
You’ve just spent a lot of time and effort accumulating information and calculating ratios or other formulas to describe your business’ current financial performance. It’s helpful to take a break, and remember where you are in your business planning—that these past few exercises are just a part of the bigger picture of assessing the current performance of your farm or business.
Risk: To what type of risk is the business exposed?
In today’s agricultural industry, risk management has become an important topic, particularly for those producers who have traditionally relied on government intervention to mitigate price and production related risks. Regardless of whether you produce corn, soybeans, grass-based milk, organic vegetables or specialty fruit trees, risk management will be an important component of your business. Without it, uncontrolled risk and uncertainty reduce the reliability of financial projections and make investment analysis difficult. Unmanaged risk also carries with it a high degree of stress for farm managers and their families.
In this section, you and your planning team will research the potential risks to your business while developing a strategy to minimize and protect against uncertainty. Agricultural risk is typically tied to personal, production and market uncertainties. The Minars’ business, for example, was exposed to significant market risk—fluctuating milk prices. Moreover, as a farmer today, you will likely encounter legal and regulatory uncertainty (institutional risk), contract risk, and other forms of financial risk. Each of these sources of risk is described briefly in Figure 28.
Figure 28.
Common Sources of Agricultural Risk
Personal risk is the result of change and uncertainty within the business. Injuries and illness are sources of internal risk that can affect your business’ ability to operate. Other sources of personal risk include a change in goals, divorce, death and fire. All of these events can have a significant impact on the long-term performance of your business. You might even consider your own lack of knowledge and experience in a new area a risk, as it may create uncertainty as you transition from one management system to another. The business may be exposed to some internal risk as you learn to control pests and build soil fertility without the use of synthetic chemicals. “This [learning process] may lead to greater production risks and the potential for lower yields,” notes organic certification specialist Lisa Gulbranson.
Production and market risks are those risks that result from weather-related events such as drought, excess rainfall, hail, extreme temperatures, insects and disease. External price risks are often tied to below-cost market prices and volatility in commodity and input prices after production commitments have been made. Institutional risk is associated with changes in government policy and regulations that govern market prices, crop insurance, waste management and livestock housing facilities.
Contract risk is associated with the reliability (or lack thereof) of contracting partners. Although the use of production and marketing contracts are cited as risk management tools, you should be aware that the contracts them-
selves may pose a risk to your operation if the contractor/contractee is unreliable. Financial risk can occur as a result of fluctuating interest rates on borrowed funds, cash flow difficulties, and erosion of equity or net worth.
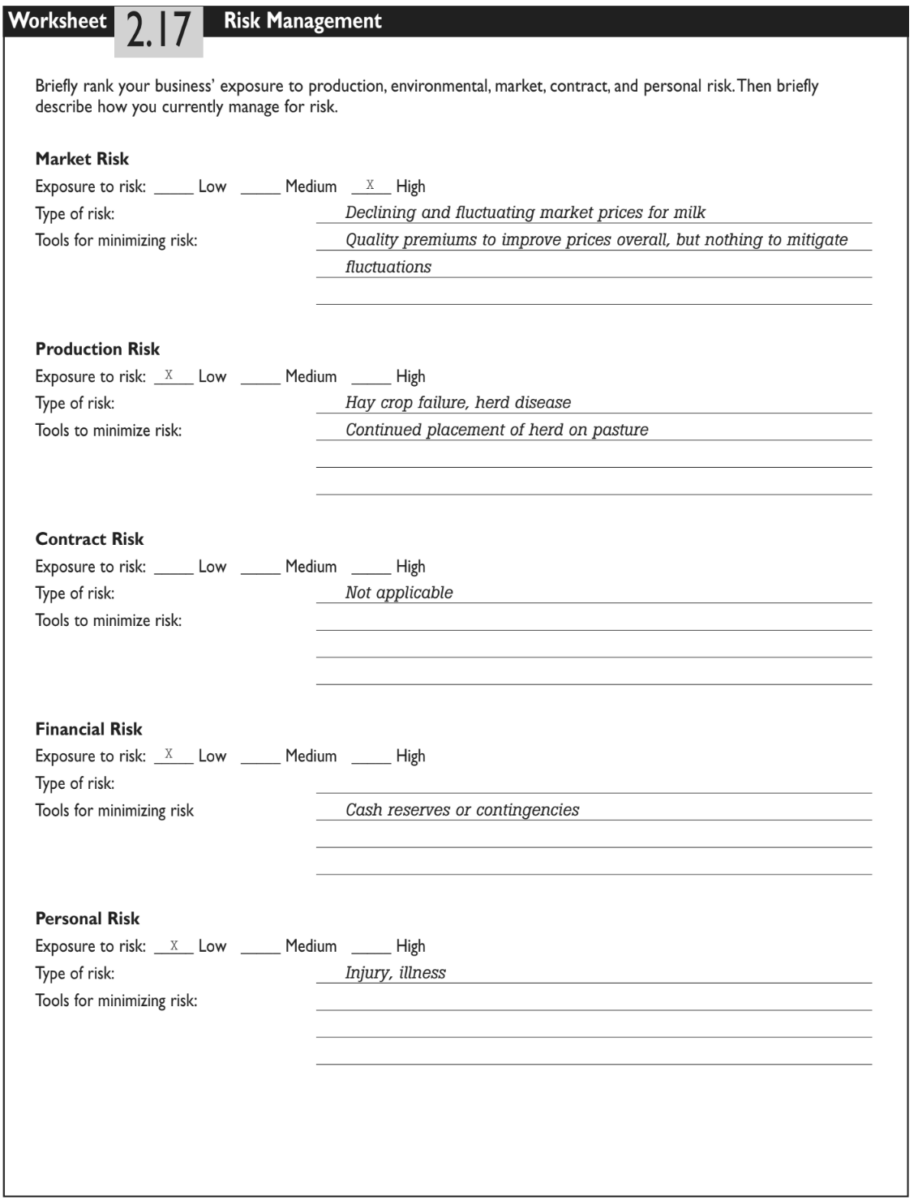
Use Worksheet 2.17: Risk Management (download worksheets for task 2) to evaluate your business’ exposure to risk. Like the Minars, rank your business’ exposure to production, market, financial and personal risk. Then list any tools or strategies that you are using to cope with and manage for that risk.
Financial Environment: What is our current business environment and how is it changing?
This is the last question to consider in assessing your farm’s current financial situation. Analysis of financial statements for your operation focuses on internal forces affecting the financial history and current situation of your farm business. Your financial future will also be affected by what is happening externally to your business, within your industry and in the general economy. The following are external forces that are especially important for the financial health of your operation:
- Interest Rates. In the late 1970s and early 1980s, high interest rates placed a heavy burden on any business that was using substantial borrowed capital. Could another such situation develop in the future?
- Employment. Will dependable, knowledgeable employees be available at a wage (including possible benefits) that you can afford to pay? Quite recently, this was a problem for many small businesses. Wage rates had increased sharply owing to high employment levels and a greater demand for dependable workers.
- Inflation. Producers who sell into the commodity markets have long known that inflation tends to increase farm costs much faster than farm prices. Is there potential that we could find ourselves in another inflationary period like that experienced during the 1970s?
- Government Actions. If your products are currently supported by government programs, will the current level of support continue as the nation’s population becomes more and more urban? Will government policies with regard to wages, environmental regulations, and reporting increase your costs? If your market depends on export demand, is there potential that either domestic political sanctions or foreign governmental actions will disrupt your sales?
As you put together your financial plans, you may want to “shock” your plans to see what would happen with a three percent increase in interest rates, a reduction of government support, or a five percent increase in your costs.
Whole Farm SWOT Analysis
You have now nearly completed a major task of your business plan. Having analyzed the history and current situation of your business with respect to marketing, operations, human resources and finances, you have assembled facts, figures and qualitative impressions about all aspects of your operation. Now you will use that information in an analysis of your Strengths, Weaknesses, Opportunities and Threats—a SWOT analysis. This can be helpful in defining and clarifying the issues you need to address in the rest of the business planning process.
Remember that in identifying strengths and weaknesses, you will be focusing on factors that are internal to your business. Opportunities and threats refer to the external environment for your business. As noted earlier, the strategy and implementation plan you develop will be shaped by both internal and external factors. Ideally, your business plan should help you build on and further develop your strengths, while minimizing the impacts of your weaknesses, if not eliminating them. At the same time, your plan needs to be responsive to the opportunities and threats your environment offers.
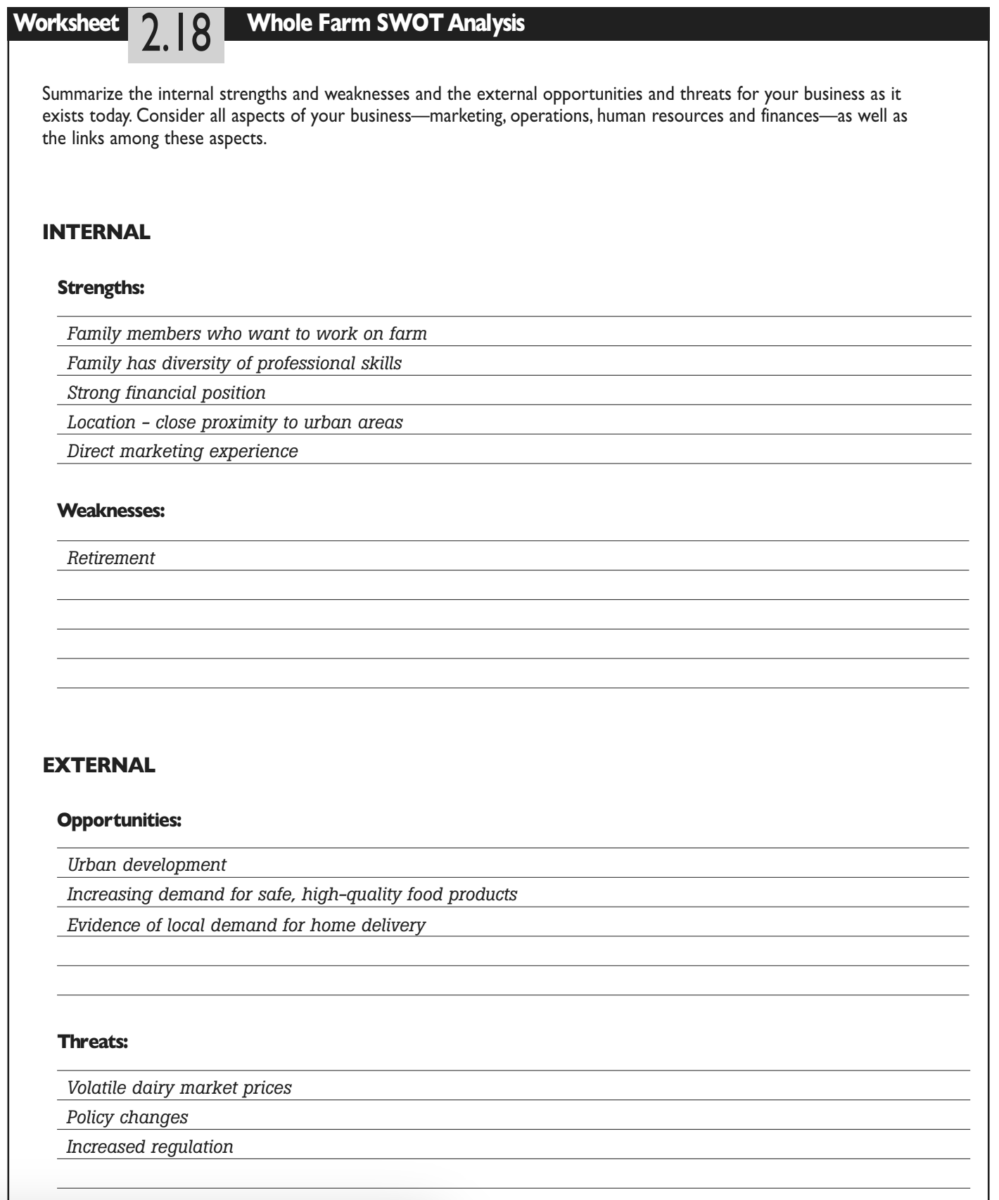
Use Worksheet 2.18: Whole Farm SWOT Analysis (download worksheets for task 2) to summarize the most important strengths, weaknesses, opportunities and threats for your business. In completing their SWOT analysis, the Minar family identified their expertise in grass-based milk production and direct marketing skills, as well as their children’s interest in returning to the farm, as major strengths. They considered the increase in urban development and rapidly growing demand for grass-based milk as major opportunities. On the other hand, they considered volatile commodity milk prices and the possibility that someone else would capture the local market for grass based milk as the most important threats facing their business. The Minars considered the addition of a milk processing enterprise because it would build on their strengths in milk production and direct marketing, and the new enterprise would employ younger family members. It was a response to an attractive opportunity, but a quick response was needed to take advantage of that opportunity.
Prepare the History and Current Situation Section of Your Business Plan
The history and current situation section of your business plan should draw on and summarize material from the Worksheets and exercises associated with this Planning Task. The content and style of this section will be influenced by the purpose of the planning process and by the audience for your plan. A suggested outline could follow that of this chapter as described below. If you decide not to include your value statement in your business plan (Planning Task One), this will be the first section of your business plan.
If your business plan is strictly for internal use, your description of the current situation may emphasize documenting key events in the history of your business. You can then assess how well your current business matches up with your personal values and aspirations, and make changes that address problems or take advantage of new opportunities. Recounting your history can help you clarify the issues that you face. It can also remind you, and others in your operation, of the reasons for making changes.
If your business plan will be used primarily as a proposal to lenders or outside investors, the current situation section of your business plan may be quite different. You may choose to use a less personal, more factual business history description in your actual business plan. This might still include a discussion of values, but there is likely to be more emphasis on providing quantitative information on operating efficiency, past financial performance, and the strength of the current financial position. In the Minars’ plan, for example, there is a narrative section on history and current situation, but there are also major sections that present detailed data on past performance and the current financial position (see Appendix A).
Regardless of your purpose in developing a business plan and your intended audience, keep in mind that it’s almost impossible to know where you are going in the future if you don’t know where you are right now. As Ken Thomas says in Developing a Longer-Range Strategic Farm Business Plan, “Projecting the future without evaluating the past and present business situation can be difficult and potentially hazardous to the future of an individual farming career.”