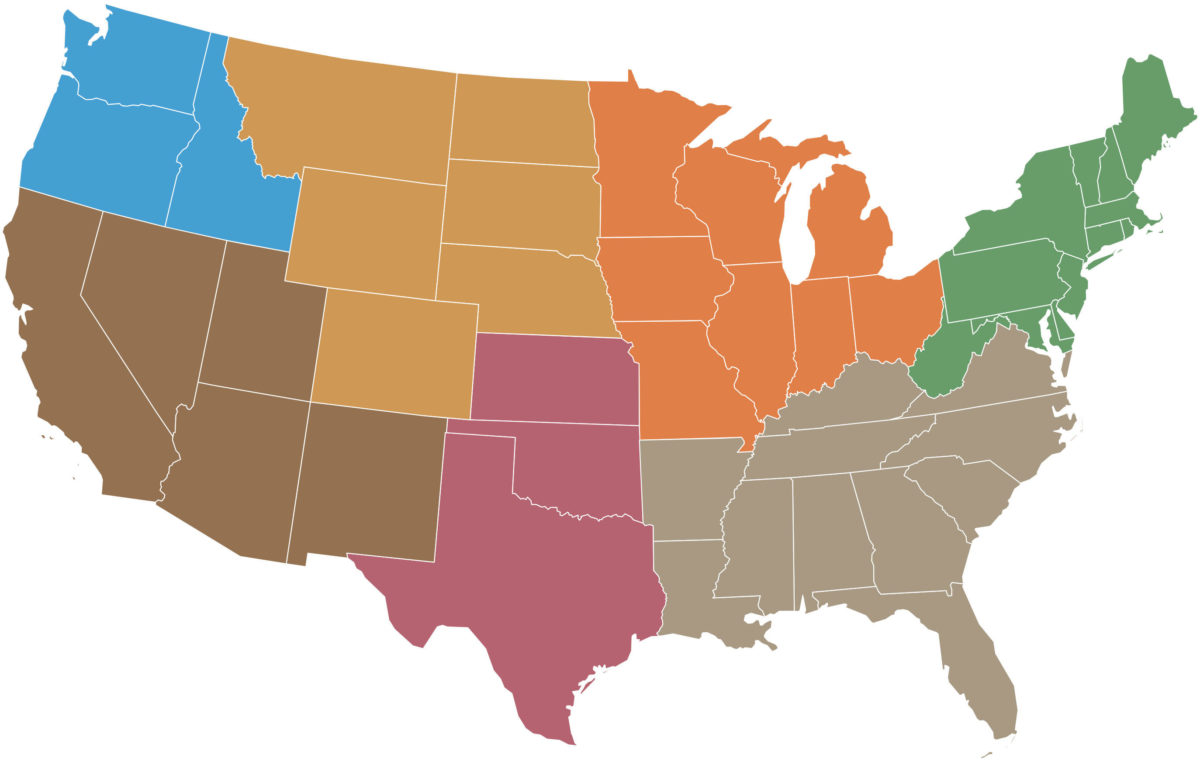
The table below is adapted from the USDA Regional Climate Hubs’ Regional Agricultural Vulnerability Assessments and the National Climate Assessment 2013 National Environmental Satellite, Data, and Information Service (NESDIS) reports. Alaska and Hawaii are not included, but can be found in the Northwest and Southwest Climate Hub reports, respectively. Expected changes are the A2 scenario at mid-century (2041–2070 average).
Definitions of terms: growing season–the period between the last occurrence of 32° in the spring and first occurrence of 32° in the fall; hot days–annual average of days with max temp exceeding 95°; hot spells–max number of consecutive days with max temps over 95°; cold days–average annual number of days with min temp below 10°; freeze days–days with a min temp below 32°; wet days–average annual number of days with precipitation over 1 inch; dry spells–max number of consecutive days with less than 0.1 inch of precipitation; heat and cold wave–a four-day period that is hotter and colder, respectively, than the threshold for a one-in-five-year recurrence for the region; extreme precipitation–the occurrence of one-day, one-in-five-year extreme precipitation for the region.
TABLE 1. Observed and Expected Changes inWeather by U.S. Region
| NORTHWEST: Higher temps, warmer winters, more frequent and intense heatwaves, more drought and more frequent wildfires are key climate change effects. Precipitation is more variable, especially in winter. Warming winters have increased rainfall, reduced snowpack, increased risk of flooding and soil saturation, advanced the timing of spring melt and reduced summer flow in river basins fed by snowmelt. The growing season is 11 days longer. These changes are expected to continue. Summer drought and winter flooding will become more frequent. | ||
| Annual Temperature | Annual Precipitation | Growing Season |
| Overall increase Greatest increase in the SE Greatest summer increase in the interior Greatest winter increase in SE Idaho | Overall increase Greatest increase in eastern Wash. Decrease in central Idaho and SW Ore. Increase in most seasons; decrease in summer | Increase: 25-35 days Greatest increase west of the Cascades |
| Hot Days | Hot Spells | Cold Days |
| Increase: 10 days Greatest increase in the SE | Increase: 6-10 days Greatest increase in southern Idaho | Decrease: 10-30 days Greatest decrease in inland regions Little or no decrease in coastal regions |
| Freeze Days | Wet Days | Dry Spells |
| Decrease: 30-40 days Greatest change at high elevations | Overall increase Greatest increase in eastern Wash. and Ore., and northern Idaho | Increase: 9-15 days Greatest increase in western Ore. |
| SOUTHWEST: Average temps have increased in each season, most rapidly in winter. Heat waves have increased in frequency. Variability in precipitation has increased, with major droughts in the first two decades of the 21st century. The growing season is 14 days longer. Rising temperatures and shifting precipitation patterns, especially in the southern part of the region, are expected to alter crop productivity, crop-water requirements, crop-water availability, and costs of water access. | ||
| Annual Temperature | Annual Precipitation | Growing Season |
| Overall increase Less warming in coastal areas Warming likely in all seasons, with greatest increase in summer | Overall decrease Largest decrease in the Sierra Nevadas and southern Ariz. and N.M. Largest decrease in summer in parts of Calif., Ariz. and N.M. | Increase: 10-38 days Least change in Calif. and greatest change in the interior far west |
| Hot Days | Hot Spells | Cold Days |
| Increase: 5-20 days Least change at high elevations and greatest change in the south and east | Increase: 8-16 days Increase of 20 days or more in the south | Decrease: 0-25 days No change in the south Greatest change at higher elevations in the interior north |
| Freeze Days | Wet Days | Dry Spells |
| Decrease: 30-40 days Greatest change at high elevations | Overall increase Greatest increase in eastern Wash. and Ore., and northern Idaho | Increase: 9-15 days Greatest increase in western Ore. |
| SOUTHERN GREAT PLAINS: Average annual temp has increased. Hot periods are hotter and cold periods are warmer. The growing season is six days longer. Winters and springs are wetter; summers are drier; and snowfall amounts have decreased, particularly in the eastern part of the region. Drought and extreme precipitation events are more frequent. These trends are expected to continue. The number of days over 100 degrees and nights over 80 degrees will quadruple. Heavy rains, flooding, drought and severe storms will become more frequent and intense. | ||
| Annual Temperature | Annual Precipitation | Growing Season |
| Overall increase Greatest increase in the summer and fall, and least in spring | Overall increase or decrease, depending on region Increase in the north and decrease in the south Little change in spring except for a decrease in Texas | Increase: 15-30 day Greatest increase in SE Texas |
| Hot Days | Hot Spells | Cold Days |
| Increase: 20-30 days Greatest increase in SW Texas | Increase: 8-24 days Greatest increase in northern Texas and Okla. | Decrease: 0-10 days Greatest decrease in the north |
| Freeze Days | Wet Days | Dry Spells |
| Decrease: 0-20 days Greatest decrease in the west | No change | Overall increase or decrease, depending on region Decrease by up to three days in Neb. Increase by 6–15 days in most of Okla. and Texas |
| NORTHERN GREAT PLAINS: Temps have risen annually and in all seasons. Northern areas warmed at the fastest rate in the nation over the 20th century. The growing season is six days longer. Winters and springs are wetter and summers drier. Snowfall has decreased, particularly in the east. Drought and extreme precipitation events are more frequent. Warming is expected to continue on average and in each season. Changes in precipitation vary by location and season, but include earlier snowmelt and stream flow runoff, a shift to more rain than snow, and snowpack declines. | ||
| Annual Temperature | Annual Precipitation | Growing Season |
| Overall increase Greatest increase in winter and summer Greatest summer increase in southwest Wyo. Greatest winter increase in Neb. and N.D. | Overall increase or decrease, depending on region Decrease in the south and increasing northward to a maximum in the NE Greatest increase in winter and fall; greatest decrease in summer | Increase: 20-30 days |
| Hot Days | Hot Spells | Cold Days |
| Increase: 0-20 days Greatest increase in SW Neb. | Increase: 0-12 days Greatest increase in the south | Decrease: 10-25 days Greatest decrease in southern Mont. and western Wyo. |
| Freeze Days | Wet Days | Dry Spells |
| Decrease: 15-21 days Greatest decrease expected in the northwest | No change | Increase or decrease, depending on region Decrease in the north by as much as six days Increase in the west by up to 15 days |
| MIDWEST: Higher annual temps, warmer winters and springs, and more extreme precipitation events during the growing season are key climate change effects. Annual temps have increased, with warmer winters and springs, and cooler summers. The growing season is nine days longer. Precipitation has increased, especially in spring, summer and fall. Snowfall has decreased in the south and west but has increased in the north, in Indiana and along the Great Lakes shorelines. These temperature and precipitation trends are expected to continue annually and in most seasons. | ||
| Annual Temperature | Annual Precipitation | Growing Season |
| Overall increase Greatest winter increase in NW Minn. Greatest summer increase in the south | Overall increase Greatest increase in the far north; little or no change in the south Increase in winter, spring and fall; no change to a decrease in summer | Increase: 22-30 days Greatest increase in northern Mich. |
| Hot Days | Hot Spells | Cold Days |
| Increase: 5-30 days Change increases moving south | Increase: 5-20 days Change increases moving south | Decrease: 10-25 days Greatest change in the NW Least change in the south |
| Freeze Days | Wet Days | Dry Spells |
| Decrease: 18-23 days Greatest decrease in the east | Overall increase Greatest increase in the states bordering Canada | Increase: 0-8 days Greatest increase in the north A slight increase in the south |
| NORTHEAST: Temps have increased annually and in each season, and total precipitation has increased, especially in fall. Rainfall intensity has increased notably, particularly in the north. More intense heavy rainfalls, milder winters, earlier spring melt and sea-level rise have increased the risk of flooding. There are more hot days, fewer cold days and more intense rain. The growing season is nine days longer. These changes are expected to continue and will vary by location and season. The frequency and intensity of flooding will increase, especially in winter and spring. | ||
| Annual Temperature | Annual Precipitation | Growing Season |
| Overall increase Both annual and seasonal temps increase with latitude Seasonal increase greatest in winter and summer; least in spring | Overall increase Greatest increase in N.J. and Del. Seasonal increase greatest in winter Summer precipitation expected to decline | Increase: 19-27 days |
| Hot Days | Hot Spells | Cold Days |
| Increase: 3-21 days Greatest change in parts of W.Va. and Md. Least change in the region’s northernmost areas | Increase: 1-7 days Greatest change in W.Va. Least change in N.Y. and New England | Decrease: 6-24 days Greatest change in the north Least change in the south |
| Freeze Days | Wet Days | Dry Spells |
| Decrease: 18-26 days Smaller changes likely along parts of the Atlantic coast | Overall increase Greatest increase in NW N.Y. and northern Maine | No change |
| SOUTHEAST: Annual and seasonal temps have steadily increased since the 1970s, particularly in summer in coastal regions, while winter temps have generally cooled over the same areas. The length of the growing season is unchanged. Seasonal precipitation patterns are changing, with the greatest changes in fall (increase) and summer (decrease). Average annual snowfall has declined. Average temps and precipitation are expected to increase; however, the rate of change will vary with location and season. | ||
| Annual Temperature | Annual Precipitation | Growing Season |
| Overall increase Greatest change in the NW; least in the SE Seasonal increase greatest in summer, especially in the NW | Overall increase Greatest increase in winter Summer precipitation increases or decreases depending on area | Increase: 0-30 days Least change in southern Fla. Greatest change in the north and in southern La. and Ala. |
| Hot Days | Hot Spells | Cold Days |
| Increase: 4-35 days Least change in the Appalachians Greatest change in south central Fla. | Increase: 4-20 days Least change in the Appalachians Greatest change in the west | Overall decrease |
| Freeze Days | Wet Days | Dry Spells |
| Decrease: 0-25 days No change in southern Fla. Change increases moving north | Overall increase Greatest increase in the Appalachians | Decrease: 0-25 days Greatest change along the Gulf Coast No change elsewhere |
